Large-scale data abnormity recognition method based on bidirectional sampling combination
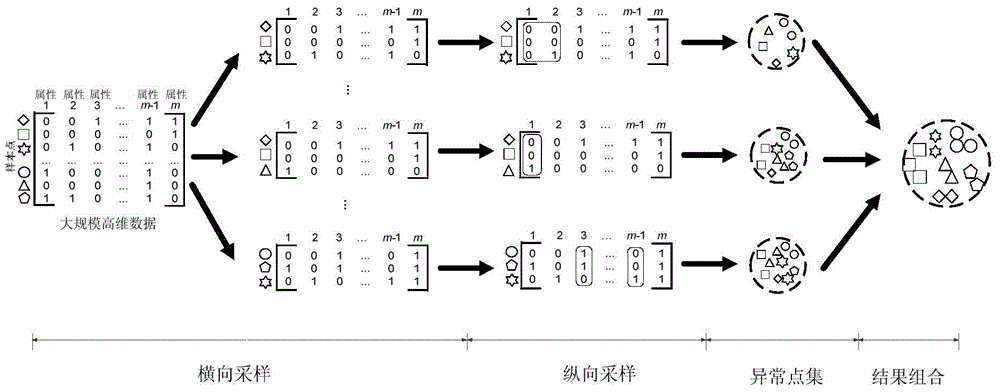
A large-scale data and anomaly identification technology, applied in the field of anomaly identification, can solve the problems of dimensionality disaster, large sample size and time complexity, etc., to reduce the impact of noise, overcome the dimensionality disaster problem, and reduce the scale
- Summary
- Abstract
- Description
- Claims
- Application Information
AI Technical Summary
Problems solved by technology
Method used
Image
Examples
Embodiment 1
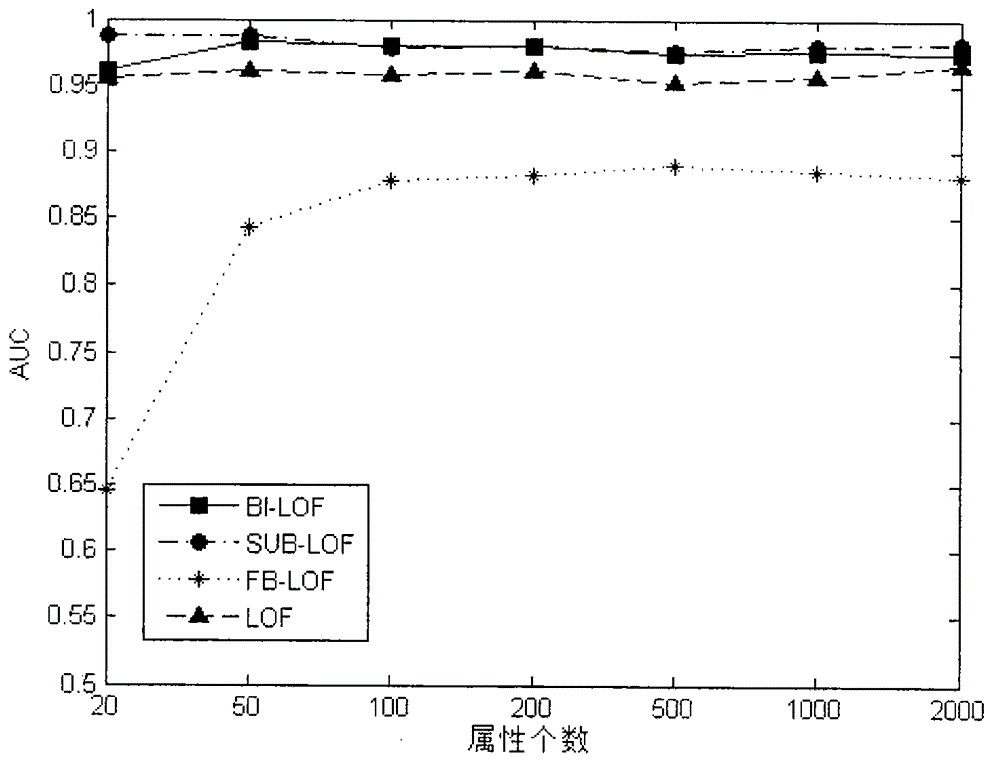
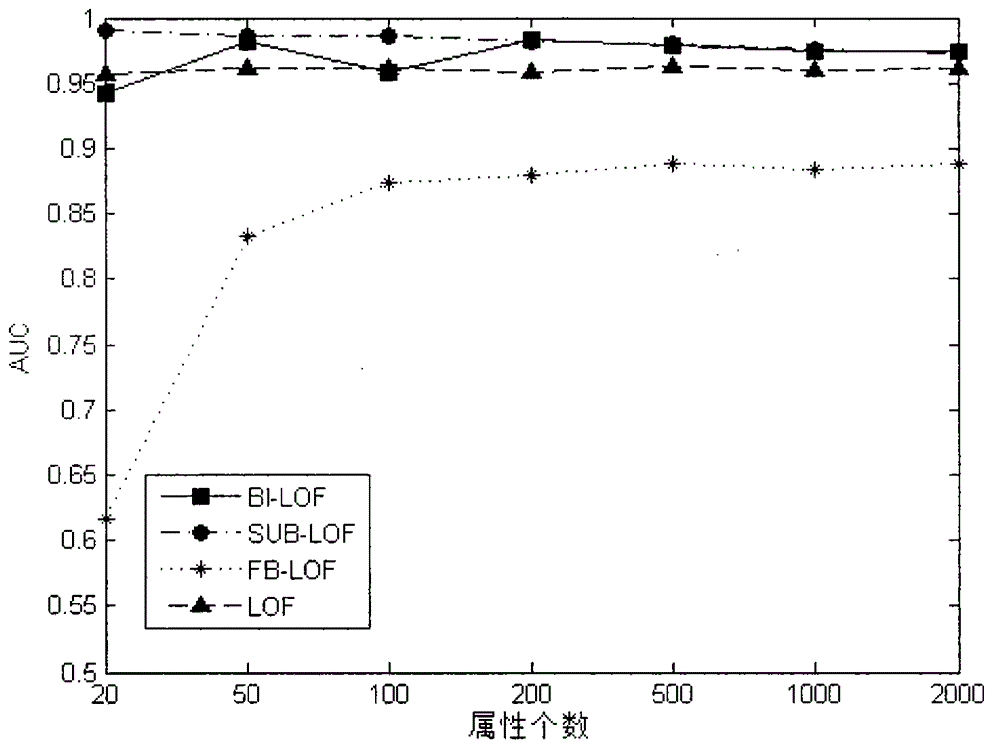
[0077] Take the simulated data set generated by multivariate Gaussian distribution simulation as an example below to illustrate the effect of the method of the present invention:
[0078] First, the simulation data set is generated by multivariate Gaussian distribution simulation. The number of sample points n of each sample data set is 1000, 2000, 5000, 10000, 50000, 100000 respectively, and the dimension m of the sample is 20, 100, 200, 500, 1000 respectively. , 2000, a total of 42 simulation data sets. Each sample data set D consists of c clusters, and the number of clusters c ranges from 5 to 10. Assume that in the simulation data set, the sample points D of each cluster c All obey the m-element Gaussian distribution, namely D c : N ( μ r c , Σ c ) ...
Embodiment 2
[0084] Take the real data set as an example below to illustrate the effect of the method of the present invention:
[0085] The real data sets are all selected from the UCI database, and Table 1 gives a description of the characteristics of all the data sets involved in the experiment. In order to simulate the abnormal situation in the data set, we randomly select s ∈ [10, 100] points from the smallest class of each data set to mark as the abnormal points of the data set, and the remaining points are marked as normal points. Since the method of the present invention is not suitable for the analysis of discrete attributes, it is necessary to eliminate the discrete attributes in some real data sets. Same as Example 1, this example uses the area under the ROC curve (AUC) to evaluate the effect of different methods of the present invention.
[0086] Table 1
[0087] dataset name
Sample points
number of attributes
number of classes
minimal class
large...
PUM
 Abstract
Description
Claims
Application Information
 - R&D
- Intellectual Property
- Life Sciences
- Materials
- Tech Scout
- Unparalleled Data Quality
- Higher Quality Content
- 60% Fewer Hallucinations
Browse by: Latest US Patents, China's latest patents, Technical Efficacy Thesaurus, Application Domain, Technology Topic, Popular Technical Reports.
© 2025 PatSnap. All rights reserved.Legal|Privacy policy|Modern Slavery Act Transparency Statement|Sitemap|About US| Contact US: help@patsnap.com


