Method and system for establishing power grid visualized perceptual model

A technology of perception model and construction method, applied in the direction of information technology support system, instrument, data processing application, etc., can solve the hidden dangers of power grid operation, single and inconvenient visualization of power grid knowledge, etc., to improve the accuracy of modeling and The effect of modeling efficiency, improving the ability to understand the environment and forecast

Inactive Publication Date: 2015-06-03
YUNNAN ELECTRIC POWER DISPATCH CONTROL CENT +1
View PDF5 Cites 21 Cited by
  • Summary
  • Abstract
  • Description
  • Claims
  • Application Information

AI Technical Summary

Problems solved by technology

[0004] The present invention aims at the problems that the information visualization model commonly used in the current power grid makes the representation form of power grid knowledge visualization single and it is not convenient for the staff to understand the meaning expressed by the power grid knowledge visualization in a comprehensive and real-time manner, resulting in potential safety hazards in the operation of the power grid, etc., and provides a power grid The visual perception model construction method interacts situational awarenes

Method used


Image

  • Method and system for establishing power grid visualized perceptual model
  • Method and system for establishing power grid visualized perceptual model

Examples


example 1

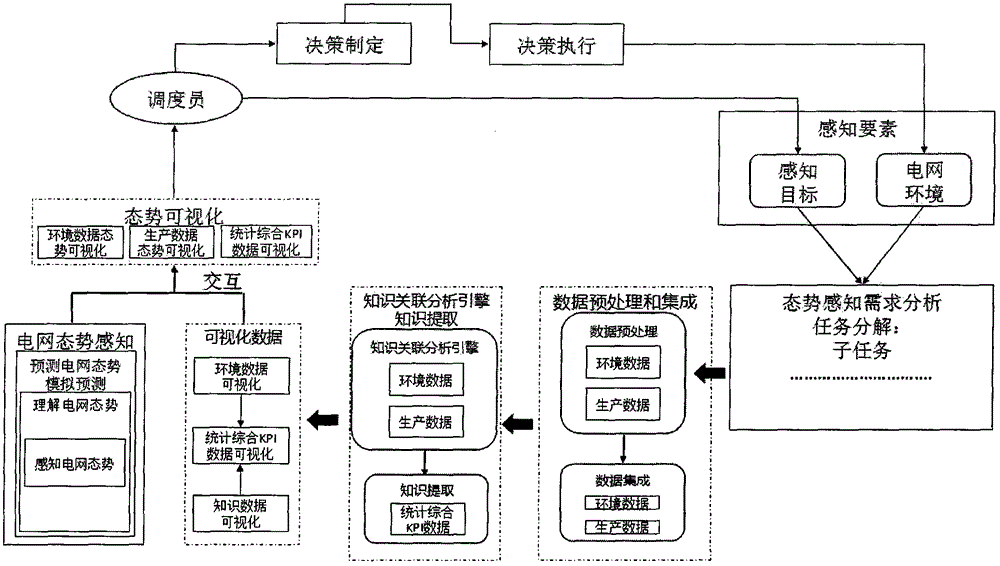
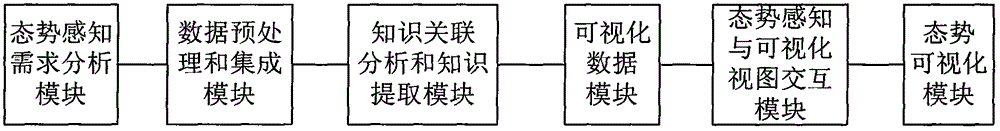
[0048] Example 1, the method for building a power grid visualization perception model of the present invention includes the following steps:

[0049] A. Situational awareness needs analysis: For the goal of safety risk assessment for dispatchers, it is necessary to obtain real-time meteorological environment monitoring data, real-time power grid operation data, and real-time power grid equipment status data of the power grid, and complete the real-time data and online data space-time of power grid equipment safety risk assessment Data fusion (including abnormal environment data, grid operation data, equipment information);

[0050] B. Carry out data preprocessing and data integration sequentially according to the results of situational awareness requirements analysis;

[0051] C. Establish a knowledge correlation analysis engine between the data of environmental elements and production elements, and then extract knowledge data, obtain real-time meteorological environment monit...

example 2

[0058] Example 2, the grid visual perception model construction system of the present invention, due to a fire in a certain area, the dispatcher needs to know whether the fire will affect the grid, and the situational awareness demand analysis module performs the situational awareness demand analysis according to the grid security risk assessment target; The processing and integration module extracts raw data, performs data cleaning, data format conversion, classifies and stores data according to environmental factors and production factors, data de-duplication processing, and data association analysis; knowledge association analysis and knowledge extraction modules acquire fire location coordinate data , obtain real-time power grid operation data information, obtain meteorological environment monitoring data information of the place where the occurrence occurs; the visual data module displays the location of the fire based on the GIS map, and at the same time displays the name ...


PUM


Abstract

The invention relates to a method and a system for establishing a power grid visualized perceptual model. The method comprises the following steps: firstly, performing situation awareness demand analysis according to the target of power grid security risk assessment, then sequentially performing data preprocessing and data integration according to the result of the situation awareness demand analysis, establishing a knowledge correlation analysis engine for data of environment factors and production factors, extracting the knowledge data to obtain statistically synthetic KPI data in a space dimension and a time dimension, adopting a visualization technology to visually show diagrams of the environment data, the statistically synthetic KPI data and the knowledge data, and combining the situation awareness with the visualized views to realize situation visualization, so as to establish the power grid visualized perceptual model. Through the model, the information of the various factors in the environment can be immediately acquired and acknowledged, the future state of the environment can be predicted, and the running state of the power grid can be shown in real time, so that users can understand and use the power grid knowledge more directly and quickly.

Description

technical field [0001] The invention relates to the technical field of smart grid operation security, in particular to a method and system for constructing a grid visualization perception model. Background technique [0002] Information visualization is the theory, method and technology of using computer graphics or image processing technology to convert information into graphics or images and display them on the computer screen for interaction. Visualization research on smart grid knowledge, on the one hand, can greatly reduce the difficulty and workload of developers, speed up the construction of grid visualization, and effectively solve the problem of "information islands" in power companies; on the other hand, it is more conducive to emergency response to emergencies When a sudden accident occurs in the power system, the staff can directly see the equipment status and the cause of the accident through the visually displayed data monitoring system, making the operation of...

Claims


Application Information

Patent Timeline
IPC IPC(8): G06Q10/04G06Q50/06
CPCG06Q10/0635G06Q50/06Y04S10/50
Inventor 王珍意蔡华祥赵川张茂林蒋亚坤赵莹宋振涛李峰雷炳银
Owner YUNNAN ELECTRIC POWER DISPATCH CONTROL CENT
Why Eureka
Try Eureka