Visualized analysis method based on industry data

An analysis method and technology of industry data, applied in the direction of electronic digital data processing, structured data retrieval, special data processing applications, etc., can solve the problems of complex data types, slow analysis speed, cumbersome data analysis, etc., and improve the goal achievement rate , clearly express the form, and efficiently analyze the effect of speed

Inactive Publication Date: 2015-06-10
INSPUR GROUP CO LTD
View PDF4 Cites 10 Cited by
  • Summary
  • Abstract
  • Description
  • Claims
  • Application Information

AI Technical Summary

Problems solved by technology

[0003] 1) There are various types of data and different data structures;
[0004] 2) There are too many useless data, which leads to cumbersome data analysis;
[0005] 3) The statistical table display is single; the results of the analysis data cannot be clearly displayed;
[0006] 4) Data interactivity is poor; information cannot be clearly expressed;
[0007] 5) The analysis speed is slow and the data cannot be parsed efficiently
[0008] Enterprises in many industries are now facing: in order to achieve goals such as understanding market dynamics, improving service quality, and increasing target achievement rates, they cannot display, analyze, and combine data matching with their own industry internal organizational data through a visual interface.

Method used


Image

  • Visualized analysis method based on industry data

Examples


Embodiment 1

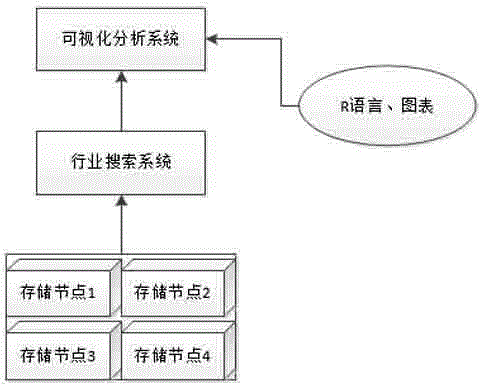
[0022] The visual analysis method is: capture the industry data on the Internet, and integrate and analyze it with the internal organization data of the industry, organize the Internet data, use R language analysis technology and front-end display charts, and divide the data according to different dimensions according to industry needs , to display the data.

[0023] The steps of the visual analysis method are as follows:

[0024] Step 1: Configure the address of the data to be analyzed; one is the file address, and the other is the database address.

[0025] Step 2: According to the factors to be analyzed, query the data;

[0026] Step 3: Set rules and data structures, and convert data in the form of files into regular data formats;

[0027] Step 4: According to the regular data format, set the analysis dimension to form a visual interface;

[0028] Step 5: The visual interface can be dragged and transformed into other presentation methods;

[0029] Step 6: Export the...

Embodiment 2

[0031] The visual analysis method is: capture the industry data on the Internet, and integrate and analyze it with the internal organization data of the industry, organize the Internet data, use R language analysis technology and front-end display charts, and divide the data according to different dimensions according to industry needs , to display the data.

[0032] The steps of the visual analysis method are as follows:

[0033] Step 1: Build an industry search system and provide users with an interface for analyzing templates; the storage data system is built on a cloud server and deployed for distributed storage;

[0034] Step 2: Configure the address of the data to be analyzed; one is the file address, and the other is the database address.

[0035] Step 3: According to the factors to be analyzed, query the data;

[0036] Step 4: Set the rules and data structure, and convert the data in the form of files into a regular data format;

[0037] Step 5: According to the reg...


PUM


Abstract

The invention discloses a visualized analysis method based on industry data. The visualized analysis method includes capturing the industry data on the internet, performing integrated analysis on the industry data and industry internal organization data, performing internet data arrangement, and by the aid of the R-language analysis technology and front-end display charts, displaying the data in terms of different dimensionalities according to industry requirements. Compared with the prior art, the visualized analysis method based on the industry data has the advantages of capabilities of classifying the data effectively, filtering useless data and expressing forms clearly and high analysis speed, and the problem about data match due to the fact that in spite of desiring to know dynamic market change, improve service quality, increase goal achievement rate and the like, existing enterprises in many industries cannot display and analyze the internet data through visualized interfaces and cannot combine the internet data with own industry internal organization data is solved.

Description

technical field [0001] The invention relates to the technical field of computer network data, in particular to a visual analysis method based on industry data. Background technique [0002] Today is the era of data explosion. The data on the Internet will bring a lot of useful information to enterprises and merchants. However, in the face of all kinds of data, they will face the following problems: [0003] 1) There are various types of data and different data structures; [0004] 2) There are too many useless data, which leads to cumbersome data analysis; [0005] 3) The statistical table display is single; the results of the analysis data cannot be clearly displayed; [0006] 4) Data interactivity is poor; information cannot be clearly expressed; [0007] 5) The analysis speed is slow and the data cannot be parsed efficiently. [0008] Enterprises in many industries are now facing: in order to achieve goals such as understanding market dynamics, improving service quali...

Claims


Application Information

Patent Timeline
Patent Type & Authority Applications(China)
IPC IPC(8): G06F17/30
CPCG06F16/20G06F16/9535
Inventor 孙海峰徐宏伟左少标
Owner INSPUR GROUP CO LTD
Why Eureka
Try Eureka