Method for predicting tourist flow volume of tourist attraction on basis of multi-source data analysis
A technology of multi-source data and passenger flow, applied in the field of smart tourism research, it can solve the problems of accuracy, real-time, fast, and effective, and achieve the effect of improving real-time.
- Summary
- Abstract
- Description
- Claims
- Application Information
AI Technical Summary
Problems solved by technology
Method used
Image
Examples
Embodiment 1
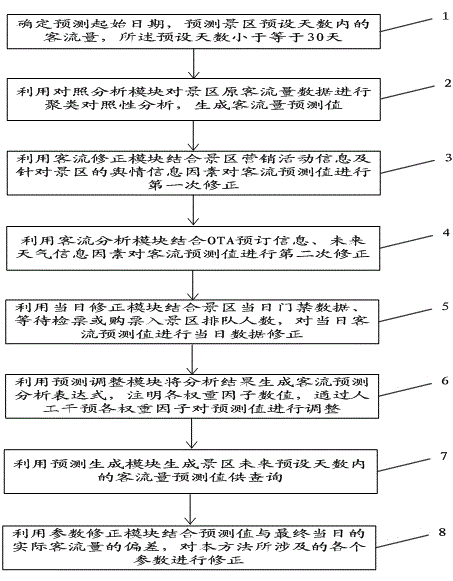
[0059] In the first embodiment, a method for predicting passenger flow in tourist attractions based on multi-source data analysis is provided, please refer to figure 1 , the method includes:
[0060] Step 1: Determine the start date of the forecast, and predict the passenger flow of the scenic spot within the preset number of days, and the preset number of days is less than or equal to 30 days;
[0061] Step 2: Use the comparative analysis module to perform clustering and comparative analysis on the original passenger flow data of the scenic spot to generate the predicted value of passenger flow;
[0062] Step 3: Use the passenger flow correction module to make the first correction to the passenger flow forecast value in combination with the marketing activity information of the scenic spot and the public opinion information factors for the scenic spot;
[0063] Step 4: Use the passenger flow analysis module combined with OTA booking information and future weather information...
Embodiment 1
[0130] Example 1: Workflow Reference figure 1 As shown, the specific steps are broken down as follows:
[0131] Step 1: Determine the starting point and time period
[0132] Determine the forecast start date and predict the passenger flow of the scenic spot in the next 7 days.
[0133] Step 2: Make traffic forecast
[0134] Since tourism is more sensitive to special dates such as weekends and holidays, it is necessary to make a simple adjustment and proofreading of the forecast start date and the same period of history (one year or several years). For example, if the start time to be predicted is Friday, then It needs to correspond to the Friday data of the week where today is located in the past years; but if it is a forecast for the Golden Week, it directly corresponds to the corresponding date of the Golden Week in the past years.
[0135] After the correspondence is completed, the average growth rate of the 30 days before the start date of this year's forecast is obtain...
specific Embodiment 1
[0149] ① Forecast start time: April 13, 2015 (Monday), select 2014 for comparison, and the corresponding start time is April 14, 2014 (Monday);
[0150] ②The 30 days before April 13, 2015 corresponded to the average growth rate corresponding to the 30 days before April 14, 2014, M=0.08 after calculation;
[0151] ③ The scenic spot once carried out a promotional activity in June 2014, and the promotional activity was carried out in April in 2015. After calculation, the marketing activity factor α = 0.02;
[0152] ④The recent online public opinion information of this scenic spot is relatively flat, here the public opinion factor β=0;
[0153] ⑤Based on calculation, the average ratio of OTA in the scenic spot in the 30 days before April 13, 2015 to the total passenger flow is 28%;
[0154] ⑥ Combined with the weather forecast of the National Meteorological Administration for the next 7 days, it is calculated that the human comfort level of the scenic spot in the next 7 days will...
PUM
 Abstract
Description
Claims
Application Information
 - R&D
- Intellectual Property
- Life Sciences
- Materials
- Tech Scout
- Unparalleled Data Quality
- Higher Quality Content
- 60% Fewer Hallucinations
Browse by: Latest US Patents, China's latest patents, Technical Efficacy Thesaurus, Application Domain, Technology Topic, Popular Technical Reports.
© 2025 PatSnap. All rights reserved.Legal|Privacy policy|Modern Slavery Act Transparency Statement|Sitemap|About US| Contact US: help@patsnap.com


