
Signal analyzing device used for synchronously separating signals and noise and analyzing method thereof

A signal analysis method and synchronous separation technology, applied in the field of signal processing, can solve the problems of signal disappearance, signal processing lag, signal search efficiency improvement of instrument analysis performance, etc., achieve accurate and more reliable center frequency, improve performance advantages, and realize cost low cost effect

Active Publication Date: 2015-12-02
CHINA ELECTRONIS TECH INSTR CO LTD
View PDF7 Cites 4 Cited by
  • Summary
  • Abstract
  • Description
  • Claims
  • Application Information

AI Technical Summary

Problems solved by technology

In addition, the search for the signal peak is carried out after the scan of the entire frequency range is completed. The start time of the search depends on the speed of the scan. In the case of small resolution, the search speed is very slow and often requires a long scan time, so Introduced severe lag in signal processing
For signals that need to be processed immediately, or some signals that change relatively quickly, if they need to be discovered, they need to be processed in depth, such as demodulation or recording, etc. After the entire frequency range is scanned, the signal may have disappeared.
In addition, when the scanning frequency band is relatively wide and the number of scanning frequency points is very large, the signal search efficiency will greatly restrict the improvement of instrument analysis performance
[0003] Disadvantages of the prior art: It is necessary to scan all the frequency points of the entire frequency band before searching for the extreme point of the spectrum power, and then search for the peak signal at the extreme point, so that the identification of the signal is far after the scanning, when the need When further analyzing and demodulating the found signal, the signal may have disappeared or jumped
In addition, it is impossible to distinguish between signal and noise, and larger noise may be regarded as a signal peak

Method used


Image

  • Signal analyzing device used for synchronously separating signals and noise and analyzing method thereof
  • Signal analyzing device used for synchronously separating signals and noise and analyzing method thereof

Examples


Embodiment Construction

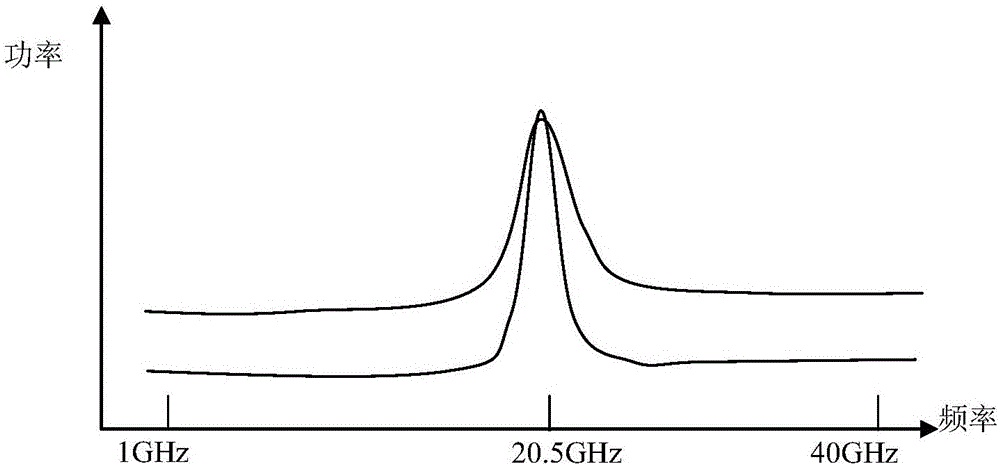
[0024] combined with Figures 1 to 2 The specific embodiment of the present invention is described further:

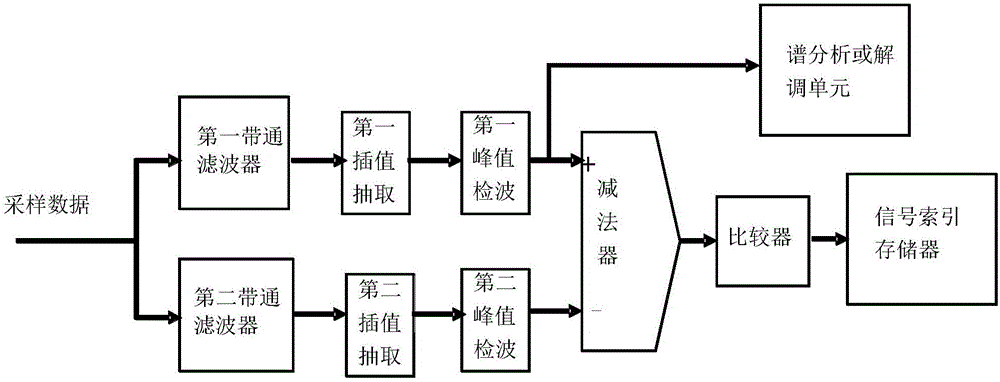
[0025] The signal analysis device for synchronously separating signal and noise includes two parallel first filtering branches and a second filtering branch. The first filtering branch includes a first bandpass filter connected in sequence, a first interpolation extraction unit and a second A peak detection unit, the second filtering branch includes a second band-pass filter, a second interpolation extraction unit and a second peak detection unit connected in sequence, wherein the first band-pass filter and the second band-pass filter are two A resolution filter with the same center frequency and different bandwidth. The input ends of the first filtering branch and the second filtering branch are respectively connected to the AD converter, and the AD converter inputs the intermediate frequency analog signal, and the output ends of the first filtering branch and the se...


PUM


Abstract

The invention discloses a signal analyzing device used for synchronously separating signals and noise and an analyzing method thereof. The input ends of the first filtering branch and a second filtering branch are respectively connected with an AD converter. The AD converter inputs medium-frequency analog signals. The output ends of the first filtering branch and the second filtering branch are respectively connected with a subtractor used for achieving subtraction operations of two paths of signals. The subtractor is connected to a signal index memory through a comparator. The comparator is used for comparing the difference setting thresholds of the two paths of digital signals and outputting the index value of the digital signal on the point to the signal index memory for storage. The noise power bandwidth characteristics and the band limited signal characteristics are fully researched. The two filtering branches are adopted to filter signals synchronously. Synchronous separation of signals and noise is achieved.

Description

technical field [0001] The invention relates to the field of signal processing, in particular to a signal analysis device and analysis method for synchronously separating signal and noise. Background technique [0002] In fast signal analysis or monitoring equipment, before in-depth analysis of the signal, it is first necessary to find the signal, and determine the center frequency point of the signal from the frequency, or the occupancy of the spectrum. The current analyzers or monitoring equipment generally use software spectrum peak search. After scanning all the preset frequency bands, software methods are used, including peak search algorithm and peak threshold judgment. By first finding the extreme point in mathematics, Including the maximum value and the minimum value, and then judge the peak threshold of the extreme value, the threshold size is set by the user, and the number of the final peak value or whether it is a peak value is limited by the parameter setting, t...

Claims


Application Information

Patent Timeline
IPC IPC(8): G01R23/167
Inventor 王保锐许建华杜会文刘丹
Owner CHINA ELECTRONIS TECH INSTR CO LTD
Learn More