Voltage sag estimation method based on quantum-behaved particle swarm optimization algorithm

A technology of particle swarm optimization and voltage sag, applied in the field of analysis and evaluation of power quality, can solve problems such as inapplicable ring network, inaccuracy, and deviation of estimated results

Inactive Publication Date: 2016-06-22
SHANGHAI MUNICIPAL ELECTRIC POWER CO +1
View PDF1 Cites 9 Cited by
  • Summary
  • Abstract
  • Description
  • Claims
  • Application Information

AI Technical Summary

Problems solved by technology

[0005] In recent years, the concept of voltage sag state estimation (VSSE) has been proposed by some scholars, that is, the data recorded by the limited monitoring bus in the system is used to estimate the voltage sag frequency of the non-monitoring bus. In PanZ.IEEETransactions, 2005,20 (2): 806-812), the author uses the least squares method to search for the path where the fault point is located, but this method is only limited to simple radial power grids, and is not suitable for ring networks; the document "Voltagesagstateestimationinpowersystemsbyapplyinggeneticalgorithms" (author : LucioJ, Espinosa-JuarezE, HernandezA.IETgeneration, transmission&distribution, 2011, 5(2):223-230) using analytical methods to transform VSSE into a problem of solving underdetermined equations. The above traditional VSSE methods have limited use The existing measurement data of the monitoring instruments are combined with the optimization algorithm to obtain the estimated results, and the historical statistical data are completely ignored. However, due to the small number of monitoring instruments in the system, the inaccurate measurement results of individual monitoring instruments will lead to large deviations in the estimation results, so The inaccuracy of measurement data and optimization algorithms will lead to the inaccuracy of traditional VSSE methods, and the calculation of historical fault statistics has always been an important part of traditional power system reliability assessment

Method used


Image

  • Voltage sag estimation method based on quantum-behaved particle swarm optimization algorithm
  • Voltage sag estimation method based on quantum-behaved particle swarm optimization algorithm
  • Voltage sag estimation method based on quantum-behaved particle swarm optimization algorithm

Examples


Embodiment

[0045] 1. Fault location method:

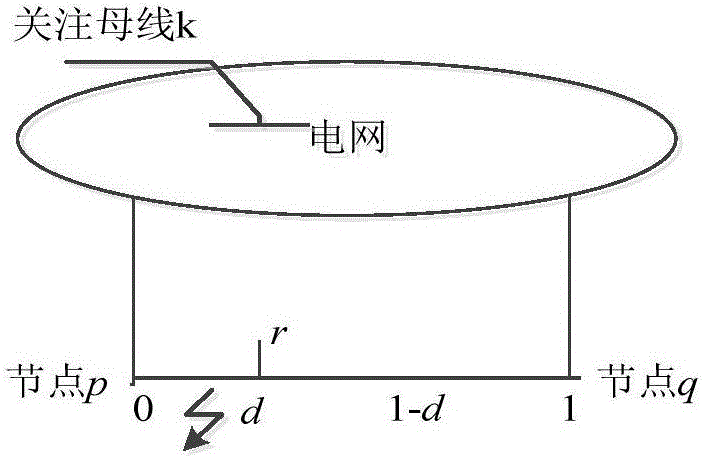
[0046] Such as figure 1 When a three-phase fault occurs in section 0 to d on a certain line, the voltage of the concerned bus k will be lower than the voltage threshold t. This section of the line is called the voltage sag area of ​​the bus k at the voltage threshold t, and the voltage of the bus k is temporarily The frequency reduction is equal to the sum of the number of faults in the voltage sag area. Extending this method to the entire power system, the voltage sag frequency of a bus of interest is equal to the sum of the number of failures in the voltage sag area under the corresponding voltage threshold. Based on the above principles, the fault location method uses historical fault statistical data of each line of the system to estimate the voltage sag frequency of each bus.

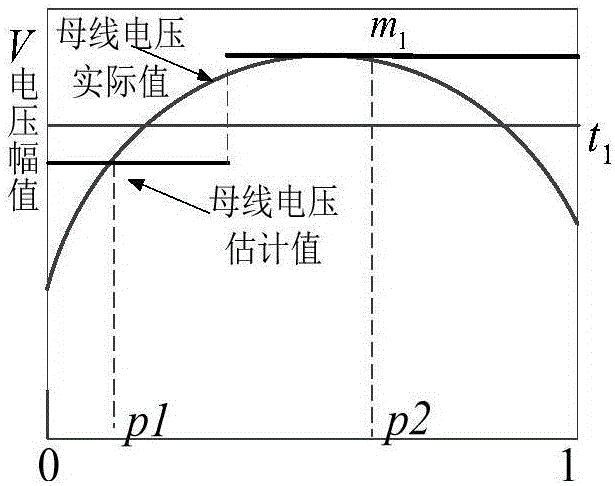
[0047] Such as figure 2 As shown, the abscissa value represents the location of the fault on a certain section of the line, the abscissa is 0 and 1 respectively repr...


PUM


Abstract

The invention relates to a voltage sag estimation method based on a quantum-behaved particle swarm optimization algorithm. The method comprises the steps: (1), each line in a power grid is divided into a plurality of sections by using a fault position method, a P fault section is set among the multiple sections, and a fault point is used for replacing a fault section; (2), an observation matrix M of a monitoring bus is established by using a random fault point and is used for expressing a relation between a state variable vector X and a measurement vector H; (3), T critical voltage values are set in an overall power grid and a general model of a state estimation method is established; (4), according to the general model of the state estimation method and the relation between a state variable vector Xt and a measurement vector Ht, an objective function and a constraint condition of an optimization problem are obtained; (5), on the basis of a quantum-behaved particle swarm optimization algorithm, an optimal solution of the optimization problem is obtained, wherein the optimal solution expresses a voltage sag frequency of a bus that is not monitored in the grid. Compared with the prior art, the provided method has advantages of comprehensive consideration, high advanced level, high efficiency, and wide application range and the like.

Description

Technical field [0001] The invention relates to the field of analysis and evaluation of power quality, in particular to a voltage sag estimation method based on a quantum behavior particle swarm optimization algorithm. Background technique [0002] With the rapid advancement of science and technology, more and more sensitive devices are connected to the power grid. Voltage sags have become one of the most frequent power quality events that cause the most economic losses. Even short-term voltage sags can cause sensitive equipment failures or Outages and a series of continuous accidents have caused significant economic losses. Therefore, the evaluation of voltage sags has become an important topic in power quality. In this paper, voltage sag frequency is used as the main indicator to describe the voltage sag information in the power grid. [0003] Installing a power quality monitor can directly record the frequency of bus voltage sags, but for economic considerations, the number of m...

Claims


Application Information

Patent Timeline
Patent Type & Authority Applications(China)
IPC IPC(8): G01R31/08
CPCG01R31/088
Inventor 罗祾潘爱强金家培
Owner SHANGHAI MUNICIPAL ELECTRIC POWER CO
Why Eureka
Try Eureka