Glass composition and electrode composition for solar cell using same
A technology of glass composition and electrode composition, which is applied to conductive materials dispersed in non-conductive inorganic materials, circuits, photovoltaic power generation, etc., can solve the problems of reduced fluidity of glass melt and reduced wettability of substrates, etc. , to achieve the effect of high fill factor, increased sintering temperature and time margin, and low contact resistance
- Summary
- Abstract
- Description
- Claims
- Application Information
AI Technical Summary
Problems solved by technology
Method used
Image
Examples
Embodiment 1 to 6 and comparative example 1 to 5
[0067] Glass compositions of Examples and Comparative Examples were prepared according to compositions and contents according to Table 1 and Table 2 below.
[0068] [Table 1]
[0069] Element
Example 1
Example 2
Example 3
Example 4
Example 5
Example 6
PbO(wt%)
46.9
37.43
44.97
59.26
47.71
65.96
TeO 2 (weight%)
49.0
58.83
54.29
36.5
50.4
30.85
Li 2 O (weight%)
4.1
3.74
0.74
4.24
1.89
3.19
total
100
100
100
100
100
100
Na 2 O (parts by weight)
-
2.67
-
3.7
1.78
1.59
K 2 O (parts by weight)
-
2.14
-
2.11
2.11
2.66
Bi 2 o 3 (parts by weight)
-
-
5.82
-
7.58
1.1
SiO 2 (parts by weight)
-
2.14
-
-
1.1
[0070] [Table 2]
[0071] Element
Embodiment 7 to 9 and comparative example 6 to 7
[0073] According to the composition and content according to the following Table 3 (unit: weight %), a conductive paste including conductive particles, glass frit, and a solvent in which a binder was dissolved was prepared.
[0074] In detail, each of the glass compositions was mixed with a vehicle (a binder and a solvent for dissolving the binder) using a PLM mixer, and then conductive particles (Ag) were added thereto, followed by secondary PLM mix. The respective pastes obtained by mixing were kneaded using a three-roll mill, and finally pastes for solar cell electrodes were prepared.
[0075] [table 3]
[0076]
experiment example 1
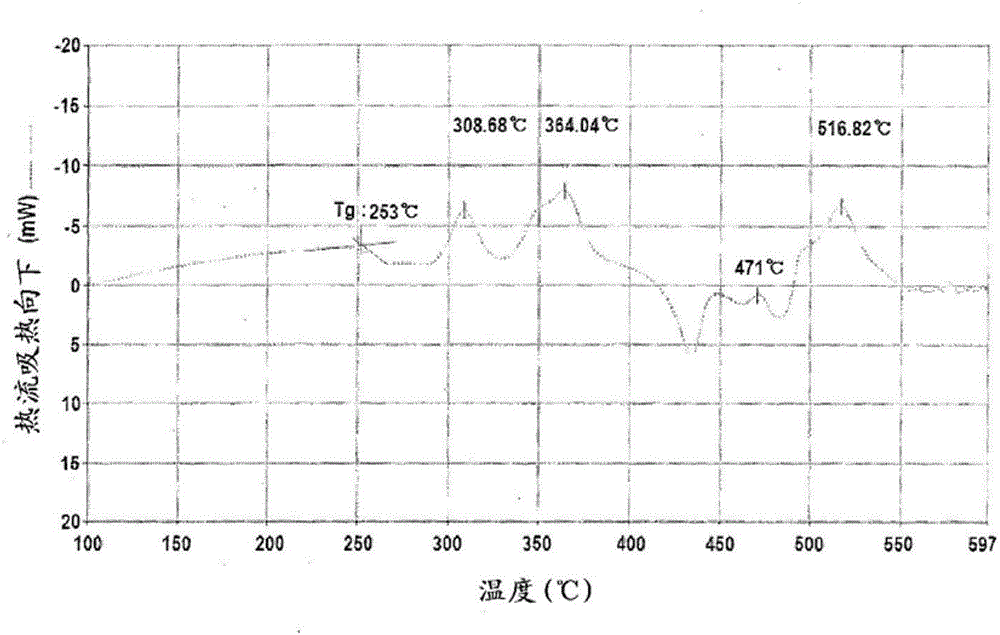
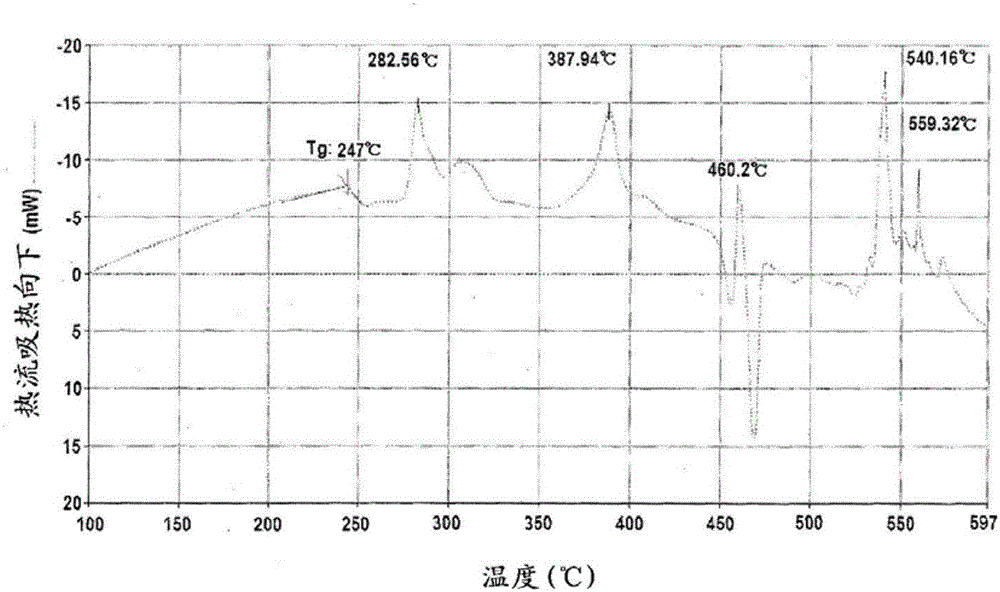
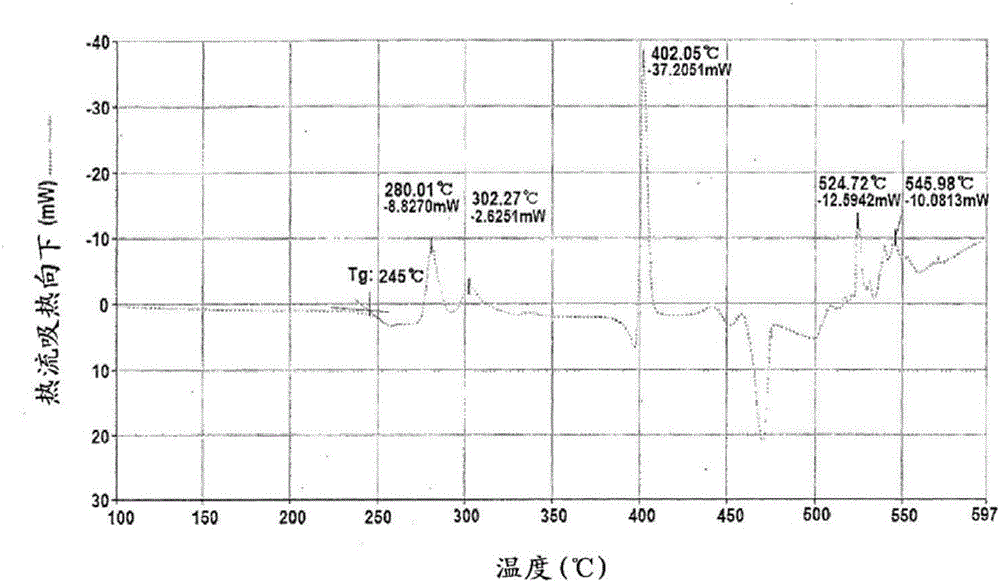
[0078] With respect to the glass compositions of Examples 1 to 3 and Comparative Examples 1 and 2, glass transition temperatures (Tg) and exothermic peaks were measured by differential scanning calorimetry (DSC). The results are given in Table 4. In addition, in Figure 1 to Figure 4 The differential scanning calorimetry results of Examples 1 to 3 and Comparative Example 1 are given in .
[0079] [Table 4]
[0080]
PUM
| Property | Measurement | Unit |
|---|---|---|
| glass transition temperature | aaaaa | aaaaa |
| diameter | aaaaa | aaaaa |
| glass transition temperature | aaaaa | aaaaa |
Abstract
Description
Claims
Application Information
 - R&D
- Intellectual Property
- Life Sciences
- Materials
- Tech Scout
- Unparalleled Data Quality
- Higher Quality Content
- 60% Fewer Hallucinations
Browse by: Latest US Patents, China's latest patents, Technical Efficacy Thesaurus, Application Domain, Technology Topic, Popular Technical Reports.
© 2025 PatSnap. All rights reserved.Legal|Privacy policy|Modern Slavery Act Transparency Statement|Sitemap|About US| Contact US: help@patsnap.com


