Data visualization analysis method based on multi-attribute rankings and application

An analysis method and multi-attribute technology, applied in the field of information visualization, can solve the problems of simultaneous display of multi-attribute and single-attribute sorting, no visual analysis method for sorting pesticide residue data, and inability to intuitively display attribute values, etc.

Active Publication Date: 2017-01-04
BEIJING TECHNOLOGY AND BUSINESS UNIVERSITY
View PDF4 Cites 17 Cited by
  • Summary
  • Abstract
  • Description
  • Claims
  • Application Information

AI Technical Summary

Problems solved by technology

[0007] When solving sorting, the existing visualization methods often cannot display both multi-attribute and single-attribute sorting at the same time; while the visualization

Method used


Image

  • Data visualization analysis method based on multi-attribute rankings and application
  • Data visualization analysis method based on multi-attribute rankings and application
  • Data visualization analysis method based on multi-attribute rankings and application

Examples


Embodiment Construction

[0042] Below in conjunction with accompanying drawing, further describe the present invention through embodiment, but do not limit the scope of the present invention in any way.

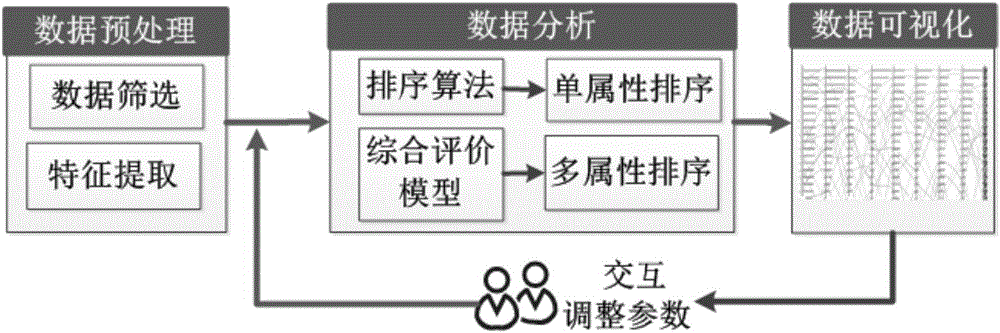
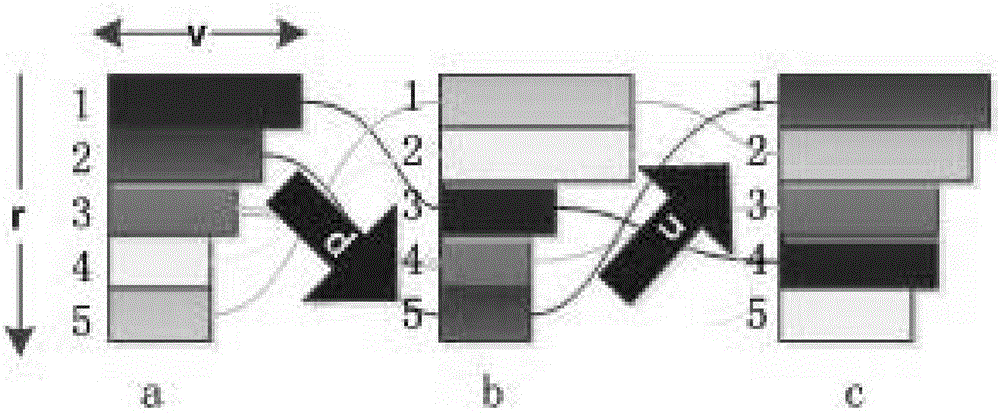
[0043] The present invention provides a data visual analysis method and application based on multi-attribute sorting. Through a visualization method combining parallel coordinates with bar graphs, the idea of ​​expressing values ​​by the length of bar graphs and the visualization method of parallel coordinates to display high-dimensional data are provided. Combined, and the comprehensive ranking algorithm is applied to the comprehensive ranking of multiple attributes. This method can also reflect the ranking of the data and the relationship between different attributes. Visual analysis of multi-attribute rankings can be carried out for pesticide residue data, comprehensive information data of universities, subject data, etc.

[0044] The data visualization method for ranking problems provided by the ...


PUM


Abstract

The invention discloses a data visualization analysis method based on multi-attribute rankings and an application. The data visualization analysis method based on the multi-attribute rankings combines a parallel coordinate visualization method with bar charts and is used for comprehensively ranking multiple attributes by utilizing the bar chart length to express values and parallel coordinates to display high-dimensional data, and the data ranking condition and an association relationship of different attributes of the data are reflected simultaneously. The data visualization analysis method comprises steps as follows: an attribute value of each risk factor in the data is obtained; the attribute values are subjected to weighting to generate comprehensive evaluation values; the attribute values are displayed in a bar chart manner, the comprehensive evaluation values are classified, and comprehensive evaluation risk factors are extracted and displayed through a radiation ring; parallel coordinates are adopted to connect all risk factors; a Sankey chart and a map are adopted for display; attribute parameters are modified through interactive operation, and a multi-attribute ranking result is displayed. The method can be used for performing multi-attribute ranking visualization analysis on pesticide residue data, comprehensive information data and subject data of universities and the like.

Description

technical field [0001] The invention belongs to the field of information visualization, and relates to a data visual analysis method, in particular to a data visual analysis method and application based on multi-attribute sorting. Background technique [0002] Sorting is a commonly used data analysis method, which is widely used in various fields. Sorting can be seen everywhere in our daily life, whether it is a national university ranking or a professional income ranking. Sorting is everywhere. An important function of sorting is to help us provide guidance when browsing things, such as what is considered "good", "popular", "high quality", etc. It can meet people's needs to filter some content to obtain information. [0003] Sorting can be single-attribute sorting, that is, sorting based on the value of a single attribute, such as the bestseller list, ranking according to the sales volume of books; it can also be multi-attribute sorting, that is, sorting based on the com...

Claims


Application Information

Patent Timeline
IPC IPC(8): G06F17/24G06F17/30
CPCG06F16/248G06F40/174
Inventor 陈谊刘莹刘瑞军王瑜
Owner BEIJING TECHNOLOGY AND BUSINESS UNIVERSITY
Why Eureka
Try Eureka