Power quality time sequence correlation assessment method

A technology of power quality and time series, applied in instruments, data processing applications, calculations, etc., can solve problems not involved in the field of power quality correlation assessment

Inactive Publication Date: 2017-02-22
QINHUANGDAO POWER SUPPLY COMPANY OF STATE GRID JIBEI ELECTRIC POWER COMPANY +3
View PDF0 Cites 4 Cited by
  • Summary
  • Abstract
  • Description
  • Claims
  • Application Information

AI Technical Summary

Problems solved by technology

[0003] At present, for power quality big data, many scholars use data mining technology in the fields of power quality data compression and denoising, disturbance identification, disturbance classification, disturbance source location and comprehensive evaluation, but the field of power quality correlation evaluation has not yet been involved.

Method used


Image

  • Power quality time sequence correlation assessment method
  • Power quality time sequence correlation assessment method
  • Power quality time sequence correlation assessment method

Examples


Embodiment Construction

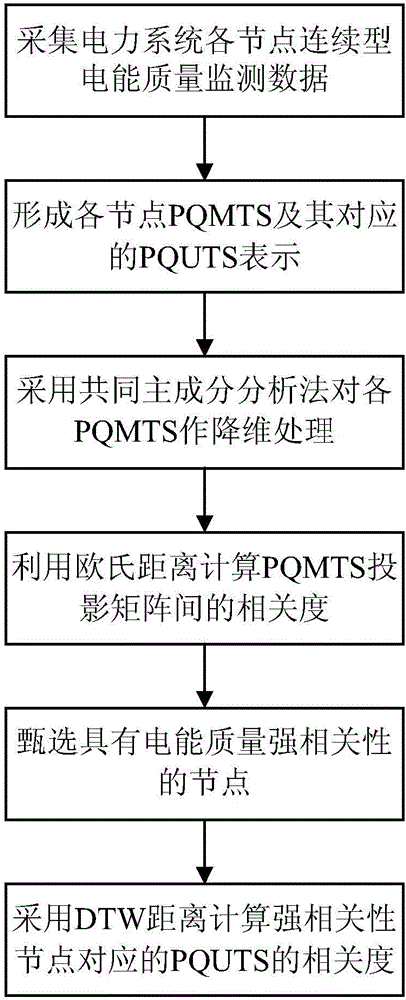
[0061] The present invention will be further described below in conjunction with the accompanying drawings. The following examples are only used to illustrate the technical solution of the present invention more clearly, but not to limit the protection scope of the present invention.

[0062] Such as figure 1 As shown, the power quality time series correlation evaluation method of the present invention comprises the following steps:

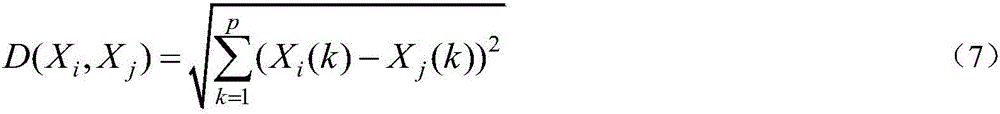
[0063] Step 1: Collect the continuous power quality data of each node of the power grid. The change of the monitoring data of various indicators over time is represented by PQUTS, and the change of the overall power quality status over time is represented by PQMTS composed of all PQUTS; the continuous power quality is For example, it includes six indicators of voltage deviation, three-phase unbalance, voltage fluctuation, harmonic distortion rate, inter-harmonic content rate and frequency deviation. The monitoring data of each indicator is provi...


PUM


Abstract

The invention discloses a power quality time sequence correlation assessment method. Continuous electric energy quality index monitoring data is represented by unitary time sequences, and the whole electric energy quality situation is represented by multivariate time sequences; a common principal component analysis method is adopted to conduct dimension reduction processing on the electric energy quality multivariate time sequences of nodes, and projections of the multivariate time sequences in common characteristic subspaces are obtained; an Euclidean distance is utilized to calculate the relevance of the multivariate time sequences after dimension reduction; electric energy quality strong-correlation nodes are selected, and a DTW distance is adopted to calculate the relevance of the unitary time sequences of indexes corresponding to the nodes. By the adoption of the method, the correlation assessment between the electric energy quality multivariate time sequences and the unitary time sequences of corresponding indexes is achieved, the operation law and propagation characteristics of electric energy quality pollution are embodied, and the mutual influence of the electric energy quality of the indexes is quantified.

Description

technical field [0001] The invention relates to a power quality time series correlation evaluation method, which belongs to the technical field of power quality time series correlation evaluation. Background technique [0002] The power quality problem of modern power grid has been widely concerned. On the one hand, due to the rapid growth of new energy grid-connected capacity and the introduction of a large number of power electronic equipment, the grid structure has become increasingly complex, and large-capacity nonlinear loads and impact loads have made power quality pollution more serious; on the other hand, computer systems , control devices, speed control drive systems, precision production lines, etc. are widely used in production and life, and these sensitive equipment put forward higher requirements for the power quality of the power grid. With the expansion of the power grid, the popularization of power quality monitoring devices, and the continuous development o...

Claims


Application Information

Patent Timeline
Patent Type & Authority Applications(China)
IPC IPC(8): G06Q50/06
CPCG06Q50/06
Inventor 邢劲于浩高云辉张奇牛益国谢小英贾清泉王珺宣文华范群力钱康
Owner QINHUANGDAO POWER SUPPLY COMPANY OF STATE GRID JIBEI ELECTRIC POWER COMPANY
Why Eureka
Try Eureka