Calculation method for calculating secondary partial tide experience cotidal chart based on relative admittance

A secondary and empirical technique, applied in the field of calculation of secondary tidal division empirical tidal maps based on relative admittance, can solve problems such as large errors in tidal maps

Inactive Publication Date: 2017-05-10
THE FIRST INST OF OCEANOGRAPHY SOA +1
3 Cites 2 Cited by

AI-Extracted Technical Summary

Problems solved by technology

[0005] The technical problem to be solved by the present invention is th...

Method used

The present invention first utilizes the harmonic constant (amplitude and delay angle) of the coastal tide gauge station to draw the distribution of the relative admittance of the research sea area, then further utilizes...

Abstract

The invention discloses a calculation method for calculating a secondary partial tide experience cotidal chart based on relative admittance. For a certain main partial tide n, an amplitude Hm and an epoch gm of a secondary tide m are calculated through utilization of relative admittance Rm/n of the admittance An and a secondary partial tide m relative to the main partial tide n. According to the method, distribution of the relative admittance of a research sea area is obtained through utilization of harmonic constants (the amplitudes and the epochs) of coast tide stations; and the distribution of the secondary partial tides is obtained through utilization of the harmonic constants of the main partial tides in the sea area. A relative error of a detection result is effectively reduced, and the relatively high precision is achieved.

Application Domain

Design optimisation/simulationSpecial data processing applications

Technology Topic

AdmittanceHarmonic constant +2

Image

  • Calculation method for calculating secondary partial tide experience cotidal chart based on relative admittance
  • Calculation method for calculating secondary partial tide experience cotidal chart based on relative admittance
  • Calculation method for calculating secondary partial tide experience cotidal chart based on relative admittance

Examples

  • Experimental program(1)

Example Embodiment

[0064] The present invention will be described in detail below in conjunction with specific embodiments.
[0065] The invention provides a method for calculating the secondary tide distribution experience and tide graph based on relative admittance, including the following calculation steps:
[0066] Step S1, for a certain main tidal component n, the admittance An is:
[0067]
[0068] among them H n And g n Are the corrected amplitude, amplitude and lag angle of the main tidal component, C n Is the tidal force coefficient (see Chen Zongyong, 1980 [25]; Fang Guohong et al., 1986 [26] , Huang Zuke, Huang Lei, 2005 [27] );
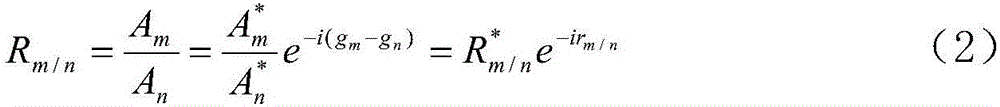
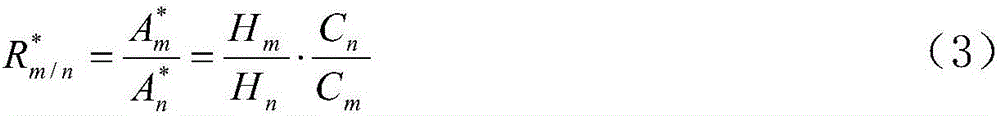
[0069] Step S2, in the same tide family, define the relative admittance of the secondary tidal component m to the primary tidal component n as:
[0070]
[0071] among them,
[0072]
[0073] r m/n =g m -g n (4)
[0074] H in formula (3) m /H n Is the amplitude ratio in traditional tidal science, g m -g n Is the late angle difference; if the amplitude ratio of the actual tidal component is the same as the ratio of the tidal force, then Equal to 1, the actual ocean It will not be exactly equal to 1, but it is close to 1 for most sea areas; if the delay angles of the two partial tides are equal, then r m/n Equal to zero, r in the actual ocean m/n Generally not equal to zero, for most sea areas, it is greater than zero (if m tidal angular velocity is greater than n tidal) or less than zero (if m tidal angular velocity is less than n tidal);
[0075] In step S3, according to equations (3) and (4), the amplitude and delay angle of the secondary tidal component m are derived as:
[0076]
[0077] g m =r m/n +g n (6)
[0078] Using the above-mentioned data, the same tide graph of small sub-tides can be drawn.
[0079] Among them, the specific calculation steps of step S2 are as follows:
[0080] Step S201, the main tidal component is M 2 , S 2 , K 1 , O 1 , The secondary component is N 2 , K 2 , P 1 , Q 1 ,
[0081] Then the amplitude ratio is The delay angle difference is
[0082] Suppose the amplitude ratio is H and the retardation angle difference is g, record A=Hsing, B=Hcosg;
[0083] Step S202, if there are N tide gauge observation points in a certain sea area, they are represented by i (i=1, 2,...,N), and the latitude and longitude of each point is among them Use negative values ​​for southern latitude, λ, In degrees, then H i And g i Is the amplitude ratio and delay angle difference of the observation points of each tide gauge station, and the distance from the observation station i to the other stations is:
[0084]
[0085] The weighted average of i points is:
[0086]
[0087]
[0088] Among them, in formula (9) and formula (10), Represents the sum of all observation points, but does not include point i;
[0089] Step S203, use the following steps to determine the relative admittance R of point i i :
[0090] The water depth of each grid point m in and around the sea area is Dm, and the latitude and longitude of point m is m=1,2...,M, the distance between grid point m and tide gauge station i is:
[0091]
[0092] Select all r im 6 m) points, average the water depth values ​​of these points and record as Calculate the corresponding Kelvin wave velocity:
[0093]
[0094] Kelvin wave wavelength:
[0095] L i = U i T (13)
[0096] Among them, T is the tidal wave period, namely
[0097] T=360°/ω (14)
[0098] Among them, ω is the tidal wave angular velocity;
[0099] Last selected
[0100] R i =κL i (κ=1/4) (15);
[0101] Step S204, according to step S402, calculate all points i=1, 2..., N with And calculate:
[0102]
[0103] Root mean square deviation
[0104]
[0105] If
[0106] δ i ≥mσ (18)
[0107] It is considered that the data at the i-th point may be abnormal, then R i Round it down, m takes 2;
[0108] In step S205, each grid point is set in the sea area according to a predetermined resolution, and the serial number of each grid point is k (k=1, 2...), and the corresponding latitude and longitude is Calculate the distance from point k to each observation point i as
[0109]
[0110] Find the weighted average of k points
[0111]
[0112]
[0113] Step S206, calculate R according to the algorithm of step S403 k , And discard data abnormal values ​​according to the algorithm of step S404;
[0114] The specific calculation steps of step S3 are as follows:
[0115] Step S301, by with Inversely calculate the amplitude ratio of each grid point And late angle difference
[0116]
[0117]
[0118] In step S302, after obtaining the relative admittance of m to n component, the harmonic constant of m component can be derived from the harmonic constant of n component according to equations (3) and (4):
[0119]
[0120] g m =r m/n +g n (6)
[0121] Use the above data to draw the corresponding tide map.
[0122] Further, verify that the remaining R after removing the outliers in step S204 i , And use the following steps:
[0123] by with Inversely calculate the amplitude ratio of each observation point And late angle difference
[0124]
[0125]
[0126] Then by
[0127]
[0128]
[0129] Calculate the mean square error of the amplitude ratio and the delay angle difference
[0130]
[0131]
[0132] After testing, the above amplitude ratio And late angle difference All are within the error range and meet the accuracy requirements.
[0133] Using the relative admittance (equivalent to amplitude ratio and delay angle difference) between the secondary tidal component and the main tidal component to calculate the harmonic constant of the secondary tidal component can often obtain more accurate results (for example, Fang Guohong, 1974 [23] ). Fang (1994 [3] ) Also gives details of Bo, Huang, and Donghai S 2 Relative to M 2 And K 1 Relative to O 1 The distribution of amplitude ratio and delay angle difference.
[0134] The present invention first uses the harmonic constants (amplitude and lag angle) of the coastal tide gauge stations to obtain the relative admittance distribution of the studied sea area, and then further uses the harmonic constants and relative admittances of the main tidal components in the sea area to give the secondary tidal components Distribution, can effectively reduce the relative error of the detection results, with high accuracy.
[0135] The present invention is not limited to the above-mentioned best embodiment. Anyone should know that structural changes made under the enlightenment of the present invention, and any technical solutions that are the same or similar to the present invention, fall within the protection scope of the present invention.

PUM

no PUM

Description & Claims & Application Information

We can also present the details of the Description, Claims and Application information to help users get a comprehensive understanding of the technical details of the patent, such as background art, summary of invention, brief description of drawings, description of embodiments, and other original content. On the other hand, users can also determine the specific scope of protection of the technology through the list of claims; as well as understand the changes in the life cycle of the technology with the presentation of the patent timeline. Login to view more.
Why Eureka
Try Eureka