Frequency spectrum analysis real-time waterfall plot implementing method

An implementation method and spectrum analysis technology, applied in the field of real-time waterfall diagram implementation, can solve the problems of missing important information features of spectrum, unable to display spectrum information in real time, large amount of data, etc. high degree of effect

Active Publication Date: 2017-05-31
NO 54 INST OF CHINA ELECTRONICS SCI & TECH GRP
View PDF5 Cites 8 Cited by
  • Summary
  • Abstract
  • Description
  • Claims
  • Application Information

AI Technical Summary

Problems solved by technology

Due to the large amount of data in the waterfall diagram method, the common waterfall diagram analysis will use the extraction non-real-time processing met...

Method used


Image

  • Frequency spectrum analysis real-time waterfall plot implementing method
  • Frequency spectrum analysis real-time waterfall plot implementing method
  • Frequency spectrum analysis real-time waterfall plot implementing method

Examples


Embodiment Construction

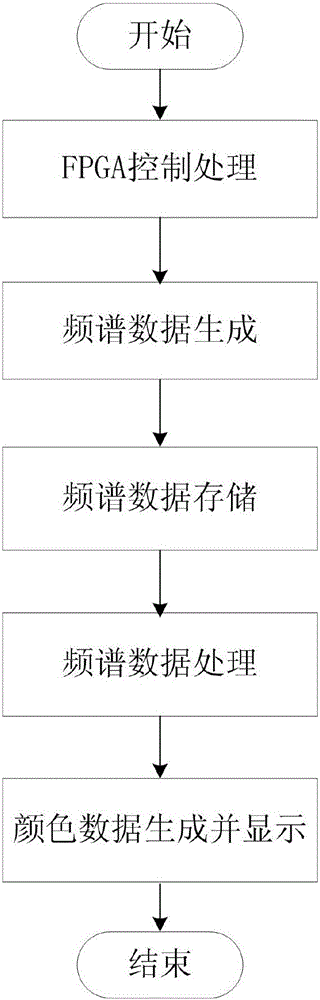
[0025] Implementation steps of the present invention: as figure 1 shown

[0026] Step 1: FPGA Control Processing

[0027] The analog-to-digital converter converts the received analog signal into a digital signal and outputs it to the FPGA, and the FPGA performs down-conversion and fast Fourier transformation on the digital signal to form spectrum data;

[0028] Step 2: Spectrum Data Generation

[0029] The spectrum data generation unit reads the spectrum data generated by the FPGA through the DMA mode, and cyclically stores the spectrum data in two data areas in the spectrum data generation unit by means of a ping-pong operation;

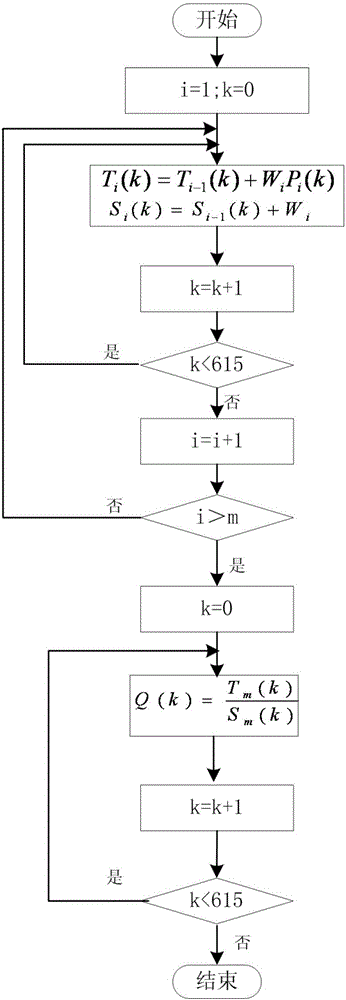
[0030] The spectrum data generation unit opens up two data areas A and B in the internal buffer area of ​​the DSP chip, each area is 615 points of data, and each data is 16 bits. The spectrum data is received and stored by means of ping-pong operation. Set the currently received spectrum data to data area A, and store and extract and calculate t...


PUM


Abstract

The invention discloses a real-time waterfall plot implementing method, and relates to a method used for implementing real-time waterfall plot in the frequency spectrum monitoring field. The method comprises the steps: a frequency spectrum data generation unit reads frequency spectrum data through a DMA mode, and circularly stores the frequency spectrum data in a data region by means of a ping-pong operation; the frequency spectrum data processing unit uses a weighting factor method to perform weight calculation on data at the same location of the frequency spectrum data in each frame; according to a time order, the amplitude of the frequency spectrum data after being subjected to weighting factor weighing is converted into color data and display on a display screen according to a self-defined color-amplitude ratio. The method disclosed by the invention has characteristics of real-time collection, real-time analysis, and real-time display; important information features of the frequency spectrum cannot be lost; the problem of frame loss caused by differences between processing speeds among hardware can be effectively avoided; and the method is particularly adapted to manufacturing a real-time frequency spectrum machine that can rapidly detect a momentary signal such as a hop signal in the frequency spectrum monitoring field.

Description

technical field [0001] The invention belongs to the field of frequency spectrum monitoring, and in particular relates to a method for realizing a real-time waterfall diagram. Background technique [0002] In spectrum analysis, in order to facilitate users to obtain more information from spectrum data, multiple traces are generally provided, such as maximum hold, minimum hold, 0-SPAN mode, etc. These are all based on two-dimensional relationships of amplitude and frequency, or amplitude and time. Time domain or frequency domain analysis can only analyze a signal with a length of one frame, especially in non-stationary signal analysis, if you need to view the three-dimensional graph of amplitude and frequency changing with time, it is very useful for dynamic signal display, and a new method is needed Show method waterfall diagram. Due to the large amount of data in the waterfall diagram method, the common waterfall diagram analysis uses the extraction non-real-time processin...

Claims


Application Information

Patent Timeline
IPC IPC(8): G01R23/16
CPCG01R23/16
Inventor 慈国辉李强李靖张红涛
Owner NO 54 INST OF CHINA ELECTRONICS SCI & TECH GRP
Why Eureka
Try Eureka