
Method for analyzing bus ODs of main passenger flow volume based on bus-mounted GPS data

A GPS data and analysis method technology, applied in traffic flow detection, data processing applications, traffic control systems, etc., can solve the problems of low accuracy, slow data update, low card swiping rate, etc., to achieve easy and reliable acquisition, saving manpower and material resources , the effect of high investigation accuracy

Inactive Publication Date: 2017-06-06
SOUTHEAST UNIV
View PDF0 Cites 5 Cited by
  • Summary
  • Abstract
  • Description
  • Claims
  • Application Information

AI Technical Summary

Problems solved by technology

This method consumes a lot of manpower and material resources, the data update is slow, and due to the complexity of filling out the form and the degree of cooperation of passengers, it has a considerable impact on the accuracy of the data. The larger the sample, the lower the accuracy may be.
[0005] At present, although some scholars use IC card swiping data to calculate bus OD information, there are many uncertain factors in this method, such as the low rate of swiping cards, and the inability to accurately obtain information such as the station where passengers get off, which makes the accuracy of the calculated bus OD information not accurate. high

Method used


Image

  • Method for analyzing bus ODs of main passenger flow volume based on bus-mounted GPS data
  • Method for analyzing bus ODs of main passenger flow volume based on bus-mounted GPS data
  • Method for analyzing bus ODs of main passenger flow volume based on bus-mounted GPS data

Examples


Embodiment Construction

[0037] The present invention will be further explained below in conjunction with the accompanying drawings and specific embodiments.

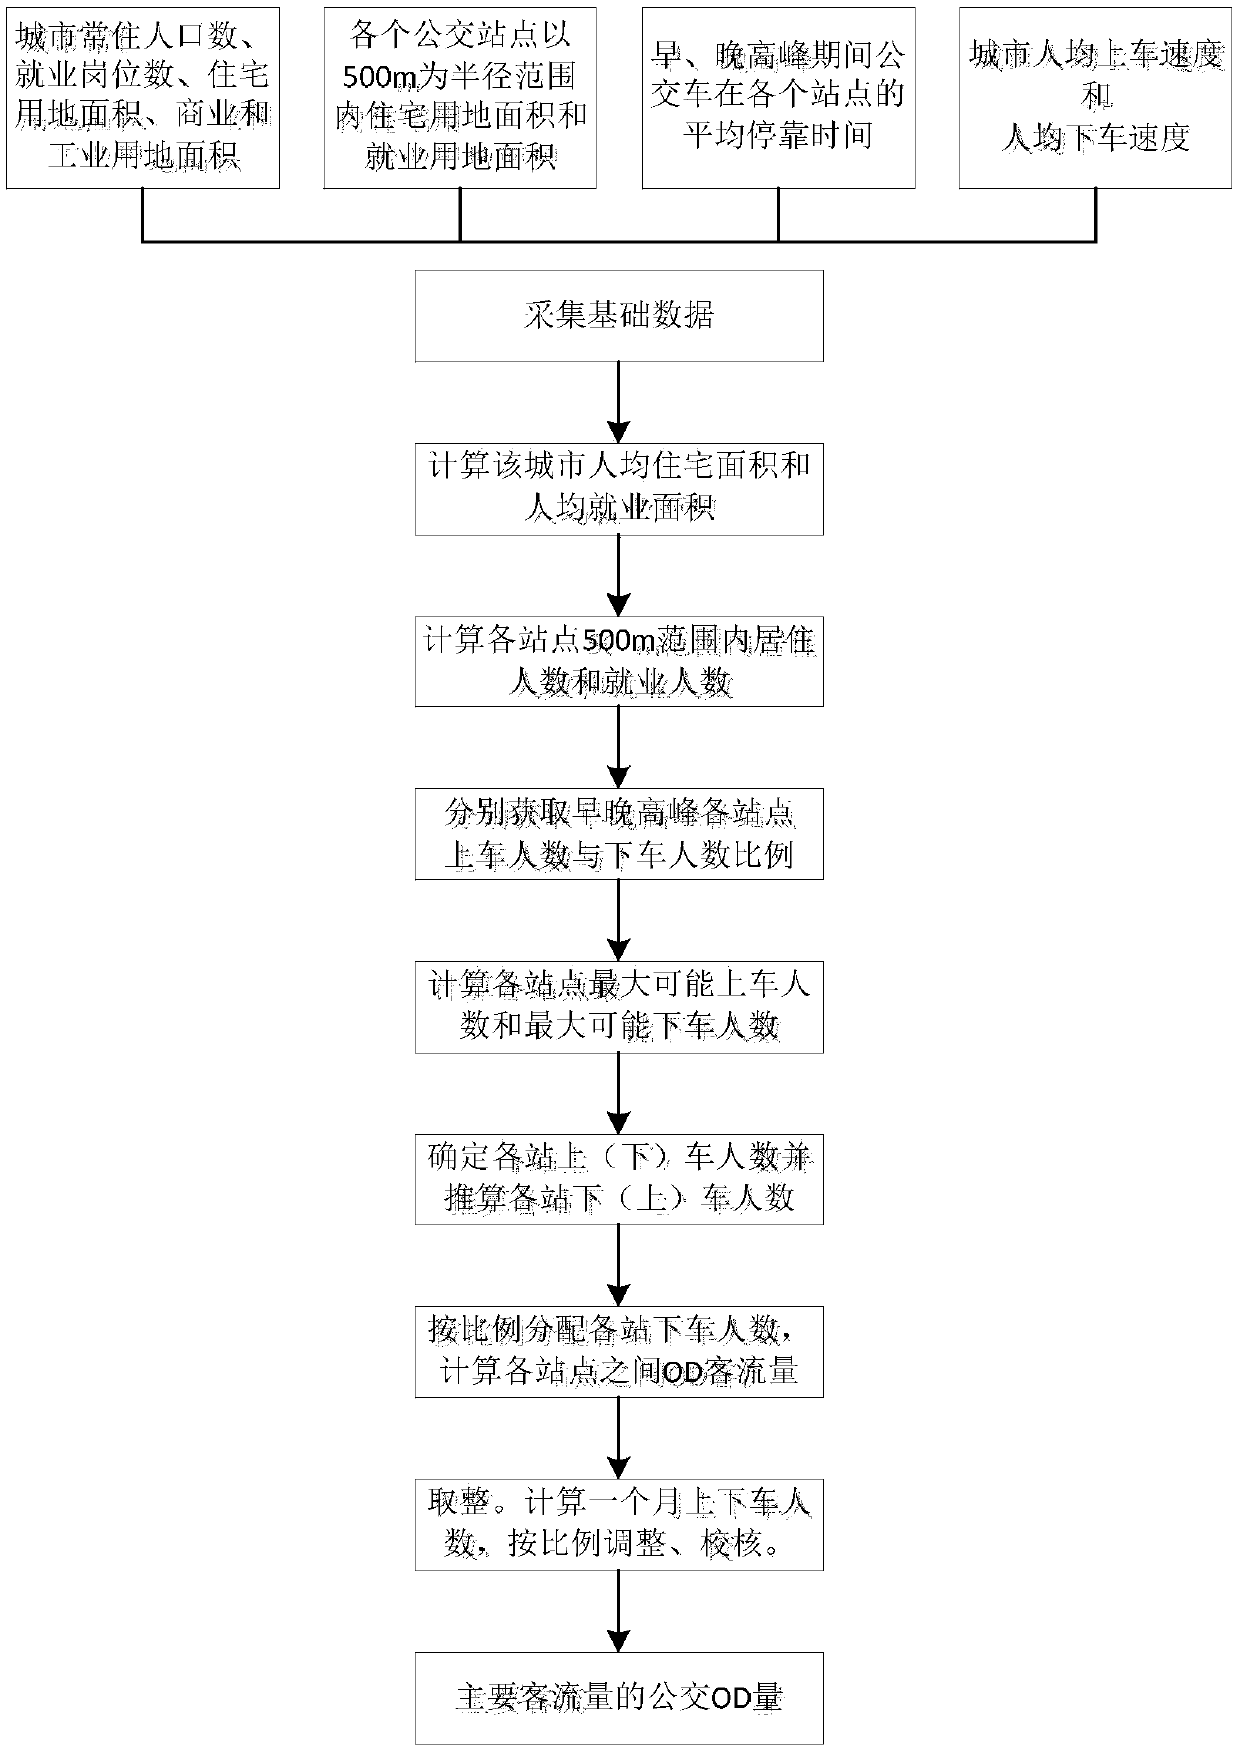
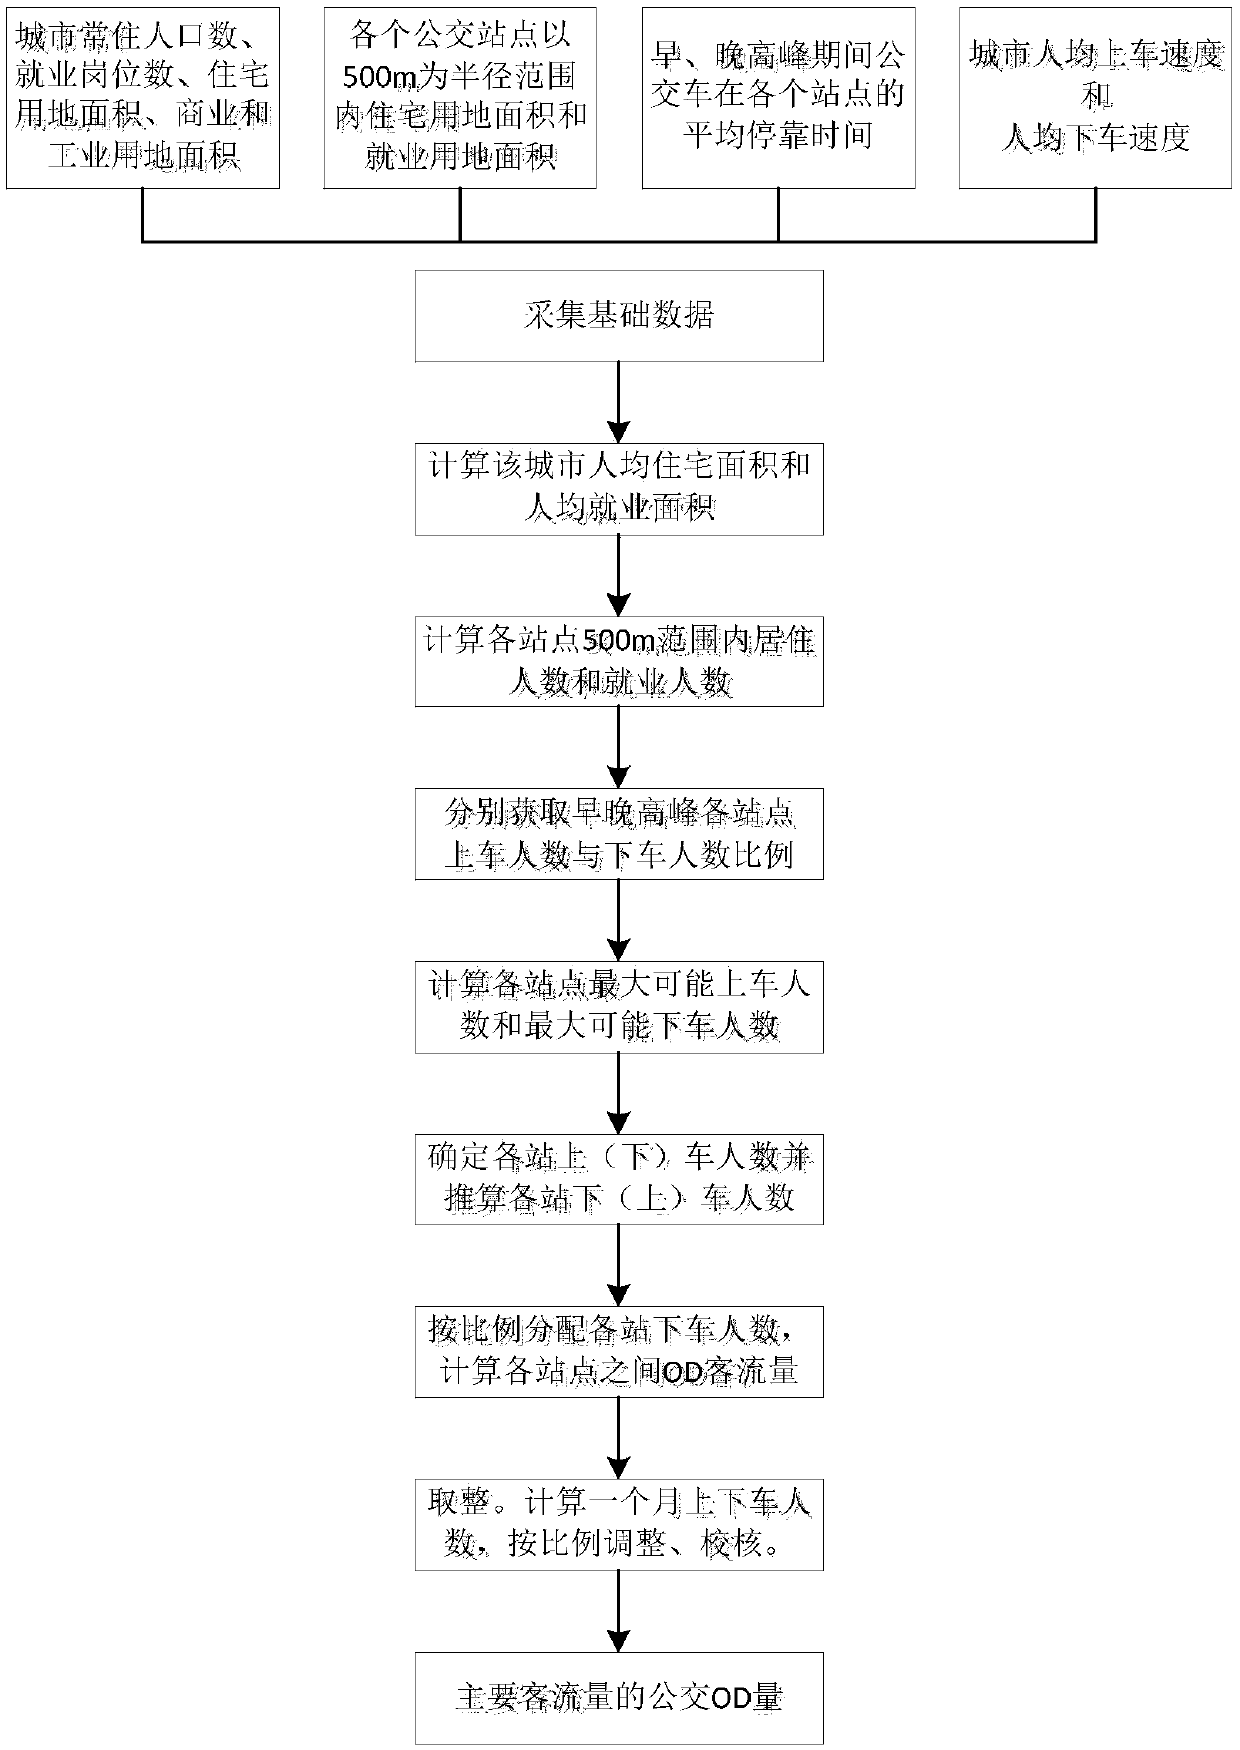
[0038] Such as figure 1 Shown is the flow chart of the bus OD analysis method of the main passenger flow disclosed by the present invention.

[0039] The present embodiment selects the operation situation of a certain bus route in Nanjing during the morning rush hour as the research object of the invention, and there are 5 bus stops in this route, such as figure 2 shown. Through the collection of basic data in the early stage, the ratio of the number of residents and the number of employed people at each station within 500m of each station is obtained, that is, the ratio of the number of people boarding the bus to the number of people getting off the bus in the morning peak. This ratio does not need to be considered at the first and last stations. The specific values ​​are shown in the following table 1. The buses participating in the detec...


PUM


Abstract

The invention discloses a method for analyzing bus ODs of main passenger flow volume based on bus-mounted GPS data. The method includes the following steps: 1. collecting basic data; 2. calculating per capita residential area and per capita employment area; 3. calculating the number of living persons and the employment quantity in a 500m range of each bus station along a certain bus route; 4. obtaining the proportion of the number of people who get on the bus to the number of people who get off the bus of each station in morning and evening rush hours; 5. calculating the maximum possible number of people who get on the bus and the maximum possible number of people who get off the bus of each station along the bus route; 6. determining the number of people who get on the bus or the number of people who get off the bus of each station, and calculating the number of people who get off the bus or the number of people who get on the bus of each station according to the proportion; 7. allocating the number of people who get on the bus of each station to downstream stations according to the proportion, and calculating the OD quantity among the stations; and 8. adjusting and checking the getting-on and getting-off proportion. The method can well solve the problem that obtaining bus passenger flow ODs relying on artificial investigation is tedious, has relatively ideal applicability, and has very high practical value.

Description

technical field [0001] The invention belongs to the field of traffic planning, and in particular relates to a bus OD analysis method of main passenger flow. Background technique [0002] In recent years, the development of urban public transportation has become one of the most important parts of urban development. Buses are an important part of public transportation. Reasonable bus route planning is the main problem that needs to be solved in the development of urban public transportation. [0003] OD (Original Destination) of bus passenger flow is the basic information for urban traffic management and planning departments to optimize the configuration of bus routes, network optimization, and station layout. Its effective acquisition is of great significance for related planning and adjustment of public transport. [0004] The traditional method of obtaining bus OD needs to issue bus forms at each station in the city, and passengers fill in the boarding time, stop, and aligh...

Claims


Application Information

Patent Timeline
Patent Type & Authority Applications(China)
IPC IPC(8): G06Q50/30G06Q10/04G08G1/01
CPCG06Q10/04G08G1/01G08G1/0112G06Q50/40
Inventor 胡晓健于焕凯徐丹顾怀中苏子毅石巍
Owner SOUTHEAST UNIV
Learn More