Method of identifying and classifying transient electric energy quality recording data

A technology of transient power quality and recorded wave data, applied in character and pattern recognition, instruments, computer parts, etc., can solve the problems of complex and huge input data, slow training speed, and difficulty in neural network recognition.

Inactive Publication Date: 2017-06-20
YUNNAN POWER GRID CO LTD ELECTRIC POWER RES INST
View PDF8 Cites 9 Cited by
  • Summary
  • Abstract
  • Description
  • Claims
  • Application Information

AI Technical Summary

Problems solved by technology

Due to the problems of spectrum leakage, susceptibility to noise, and lack of intuition of the transformation results in wavelet transform, and the input data is complex and huge, the training and recognition of neural network is difficult, the training speed is slow, and the training accuracy is low, which ultimately affects the whole method. Recognition and Classification Effects

Method used


Image

  • Method of identifying and classifying transient electric energy quality recording data
  • Method of identifying and classifying transient electric energy quality recording data
  • Method of identifying and classifying transient electric energy quality recording data

Examples


Embodiment 1

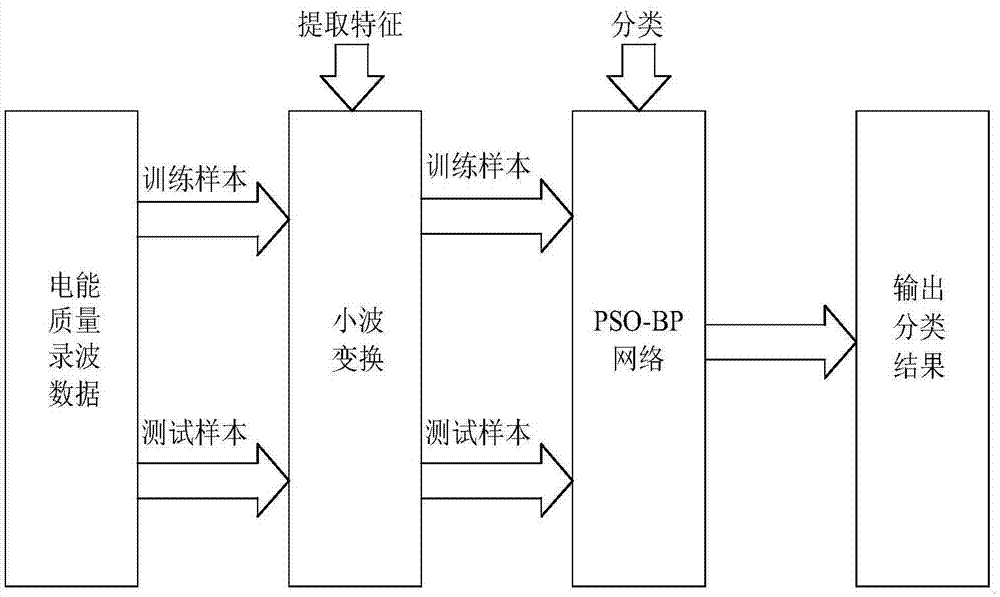
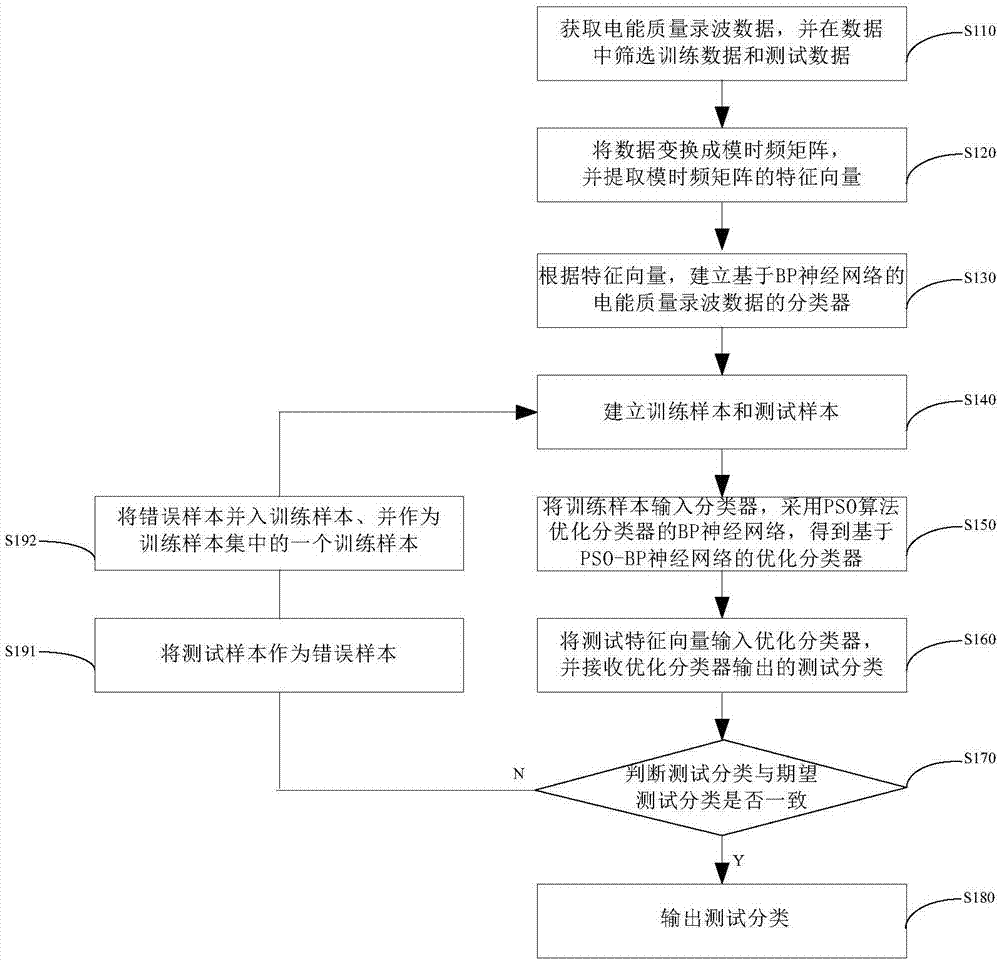
[0031] The identification and classification method of transient power quality recording data provided by the present invention comprises the following steps:

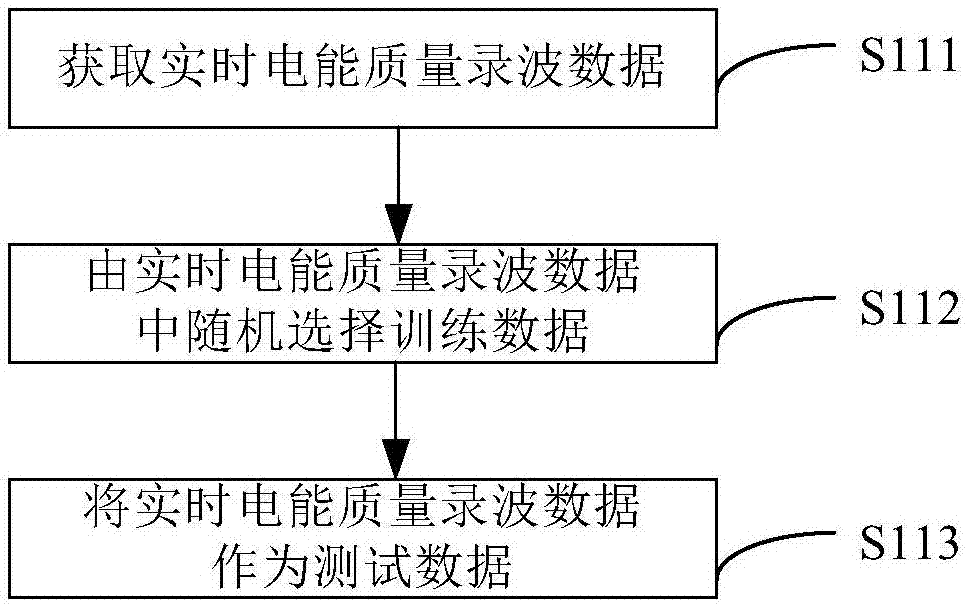
[0032] Step S110, acquiring power quality wave data x(t), and filtering training data and test data from the data x(t). Specifically, such as image 3 As shown, step S110 also includes the following steps:

[0033] Step S111, collect and acquire real-time power quality wave data on the user side or the system side in real time. The real-time power quality wave data is the voltage amplitude variation curve at different times, which is the power quality wave data x(t).

[0034] Step S112, randomly sampling in the real-time power quality recording data, and selecting training data for training the subsequent BP neural network. Step S113, using the real-time power quality recording data as test data to detect the user's power quality condition.

[0035] Step S120, transforming the data into a modulo-time-frequency matri...

Embodiment 2

[0066] In step S110, in addition to the implementation mode provided in Example 1, as Figure 4 As shown, the following steps may also be specifically included:

[0067] Step S114, collect and obtain the real-time power quality wave data of the power quality on the user side or the system side in real time, and at the same time collect the historical power quality wave data stored in the database, the real-time power quality wave data and the historical power quality wave data. The wave data are amplitude change curves at different times, and they are all wave data of power quality recording.

[0068] Step S115, randomly sampling in the real-time power quality recording data, and selecting the training data for training the subsequent BP neural network; or randomly sampling in the real-time power quality recording data and historical power quality recording data, and selecting training data for the subsequent BP neural network The training data for training the network; or ra...

Embodiment 3

[0071] In step S110, in addition to the implementations provided in Embodiment 1 and Embodiment 2, as Figure 5 As shown, the following steps may also be specifically included:

[0072]Step S117, generating simulation data based on MATLAB software simulation, wherein the simulation data includes voltage sag data, voltage swell data, voltage interruption data, transient oscillation data and transient pulse data. Specifically, the expression of the simulation data of power quality is shown in Table 1.

[0073] Table 1 Expression of simulation data of power quality

[0074]

[0075] Step S118, obtaining simulation data and real-time power quality recording data.

[0076] In step S119, the simulation data is used as training data, and the real-time power quality recording data is used as test data.

[0077] At this time, since the type of simulation data is known, there is no need to judge and classify the type of simulation data through the historical data characteristics o...


PUM


Abstract

The invention discloses a method of identifying and classifying transient electric energy quality recording data. The method includes the following steps: obtaining electric energy quality recording data, and screening training data and test data among the data; converting the data into a module time frequency matrix, and extracting a feature vector of the module time frequency matrix; according to the feature vector, establishing a classifier of the electric energy quality recording data on the basis of a BP neural network; establishing a training sample and a test sample; inputting the training sample into the classifier, optimizing the BP neural network of the classifier through a PSO algorithm, and obtaining an optimized classifier of the electric energy quality recording data on the basis of a PSO-BP neural network; inputting a test feature vector into the optimized classifier, and receiving test classification output from the optimized classifier; determining whether the test classification and expected test classification are consistent; and if the test classification and the expected test classification are consistent, outputting the test classification. The method has the advantages of being high in identification efficiency, being high in identification accuracy, and exhibiting the high anti-interference capability.

Description

technical field [0001] The invention relates to the technical field of power quality analysis, in particular to a method for identifying and classifying transient power quality wave recording data. Background technique [0002] With the rapid development of science and technology and the national economy, new energy sources such as photovoltaics and wind power in the power system are connected to the grid on a large scale. In addition, more and more large-capacity nonlinear loads are widely used in the power system, such as electrified railways, metallurgical etc., making the power quality problem of the power system more and more serious. In order to grasp the impact of power quality problems on production activities, power quality monitoring points are set up at many grid-connected points of nonlinear loads to realize continuous monitoring of power quality at grid-connected points. The power quality monitoring device can not only obtain steady-state power quality data und...

Claims


Application Information

Patent Timeline
Patent Type & Authority Applications(China)
IPC IPC(8): G06K9/62
CPCG06F18/214G06F18/24
Inventor 郭成周鑫覃日升李胜男徐志
Owner YUNNAN POWER GRID CO LTD ELECTRIC POWER RES INST
Why Eureka
Try Eureka