Side slope reliability analysis method based on MRVM-AFOSM
An analysis method and reliability technology, applied in special data processing applications, instruments, electrical digital data processing, etc., can solve the problems of available variance, sparse model structure, and few required parameters, and achieve the best fitting and prediction capabilities , accurate calculation results and fast calculation speed
- Summary
- Abstract
- Description
- Claims
- Application Information
AI Technical Summary
Problems solved by technology
Method used
Image
Examples
Embodiment 1
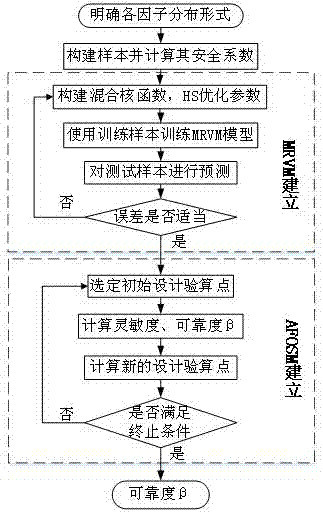
[0051] Such as figure 1 As shown, the calculation flow chart of slope reliability analysis method based on MRVM-AFOSM, which specifically includes the following steps:
[0052] Step 1. Identify each impact factor X i The distribution form of (i=1,2,...,k) constructs the input factor of the sample, and the influence factor is a factor that affects the stability of the slope, and then adopts the traditional slope stability factor of safety method to calculate the sample safety factor (this embodiment Use the Bishop method in the limit equilibrium method to calculate the safety factor of slope stability), and use the sample safety factor as the output factor of the sample; the sample is divided into training samples and test samples;
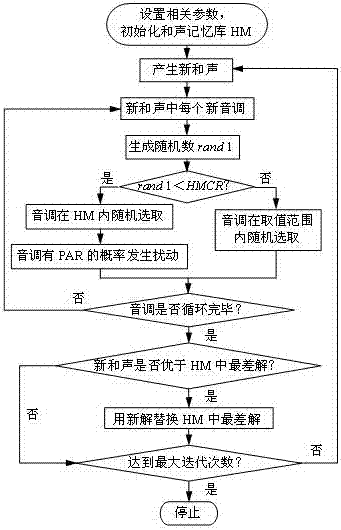
[0053] Step 2. Construct the hybrid kernel function MRVM, use the HS algorithm to optimize the kernel parameter value, and use the training samples to train the MRVM;
[0054] MRVM is an improvement and extension of the kernel function of RVM, an...
Embodiment 2
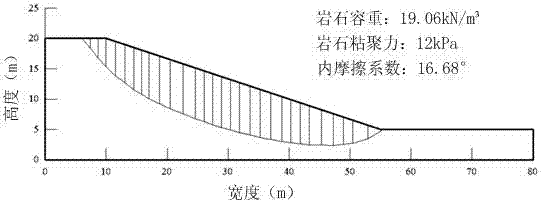
[0120] In order to contrast with RVM-FOSM, this embodiment calculates the reliability of a single-layer slope, the shape of the slope is as follows image 3 As shown, the calculation mainly considers rock cohesion C, internal friction coefficient The influence of rock bulk density γ on slope safety and stability, the average values are: C=12kN / m 2 , γ=19.06kN / m 3 . Assuming that the independent variables are all non-correlated normal distributions, the reliability of slope stability is calculated when the coefficients of variation are 0.05%, 0.10%, and 0.15%, respectively. For comparison, all sample data are from literature (Bucher CG, Bourgund U.A fast and efficient responsesurface approach for structural reliability problems. Struct Safety 1990; 7:57–66). There are 40 groups of samples in total, and the first 28 groups are training samples, which mainly complete the training task of MRVM. The latter 12 groups are test samples for testing the fitting effect of MRVM. ...
Embodiment 3
[0134] On the basis of the above-mentioned embodiment, in order to contrast with SVM-FOSM, this embodiment calculates the reliability of a certain multi-layer slope, the shape of the slope is shown in Figure 7 . The slope is divided into three layers, and the material parameters of each layer are shown in Table 4. It is assumed that the independent variables are all non-correlated normal distributions.
[0135] Table 4
[0136]
[0137] Since the original article did not provide samples, this article puts each variable in Latin hypercube sampling is performed in the range to generate 48 groups of samples, of which 36 groups are used for training and 12 groups are used for testing. After many trial calculations, the MRVM kernel parameters m=0.9999955, c=15.33301, η=0.73802, r=7.03048, q=1.55978 were finally determined. The average absolute error of the 36 sets of training data was 0.016, and the average relative error was only 1.33%. Fitting effect such as Figure 8 sh...
PUM
 Abstract
Description
Claims
Application Information
 - R&D
- Intellectual Property
- Life Sciences
- Materials
- Tech Scout
- Unparalleled Data Quality
- Higher Quality Content
- 60% Fewer Hallucinations
Browse by: Latest US Patents, China's latest patents, Technical Efficacy Thesaurus, Application Domain, Technology Topic, Popular Technical Reports.
© 2025 PatSnap. All rights reserved.Legal|Privacy policy|Modern Slavery Act Transparency Statement|Sitemap|About US| Contact US: help@patsnap.com


