Method for constructing school district pressure model through adoption of map technology

A pressure model and map technology, applied in maps/plans/charts, educational tools, data processing applications, etc., can solve the problems of wasting financial and material resources and manpower, and achieve the effect of reducing work costs and improving efficiency

Inactive Publication Date: 2017-10-24
SHANDONG INSPUR CLOUD SERVICE INFORMATION TECH CO LTD
View PDF5 Cites 10 Cited by
  • Summary
  • Abstract
  • Description
  • Claims
  • Application Information

AI Technical Summary

Problems solved by technology

The traditional method is that each school notifies the residents of each community in the area, and goes to the school with relevant documents to pre-register, and then the school sends staff to go door-to-door to verify statistics, summarize the number, and conduct a thorough investigation of enrollment. This manual statistical method will be wasteful. A lot of financial and human resources

Method used


Image

  • Method for constructing school district pressure model through adoption of map technology

Examples


Embodiment 1

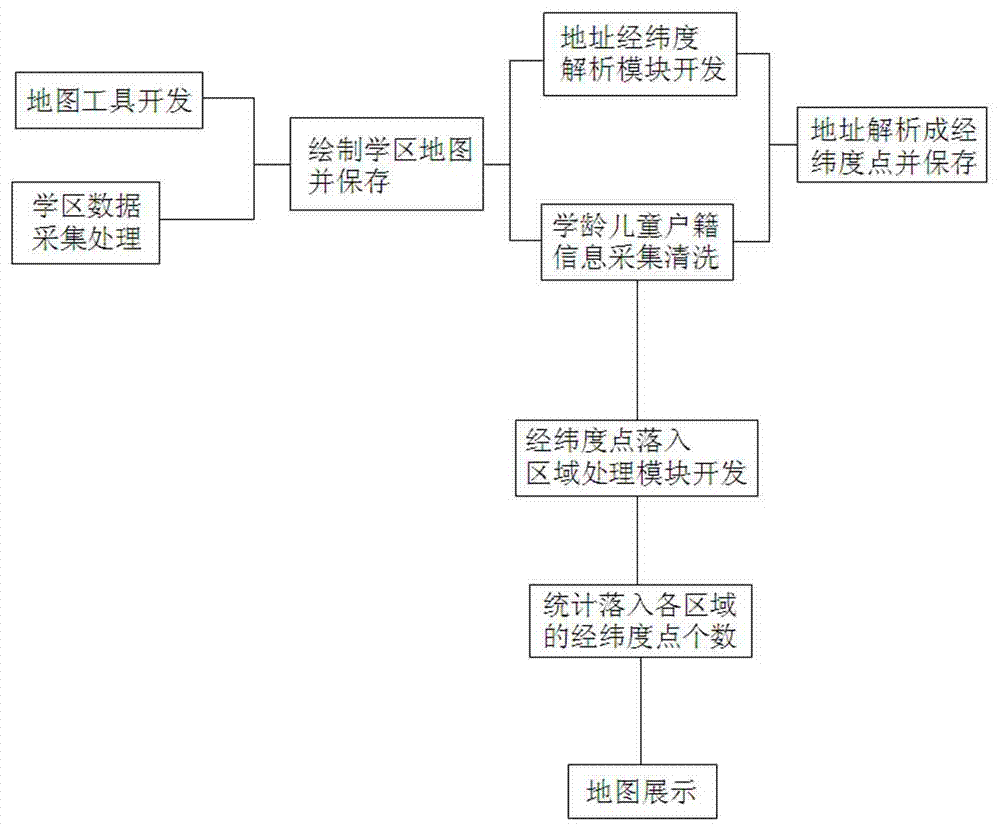
[0028] Establish a school district pressure model using map technology:

[0029] The model is mainly composed of map secondary development module, data processing module, address longitude and latitude analysis module, map area drawing module, longitude and latitude point falling area processing module and data visualization module.

[0030] The map secondary development module calls the API interface provided by the map for secondary development, realizes free drawing of areas on the map, and saves the drawn areas in the database in the form of latitude and longitude.

[0031] The data processing module collects and organizes the school district information of the city, the specific school district range of each school, and uses the map secondary development module to draw the school district area.

[0032] The address longitude and latitude parsing module analyzes the population and household registration information of the Public Security Bureau, and extracts the household ...


PUM


Abstract

The present invention discloses a method for constructing a school district pressure model through adoption of a map technology. The method comprises the following steps: drawing a school district area on a map, performing statistics of school-age children's household registration information in the household registration information and converting the school-age children's household registration information to longitudes and latitudes, performing statistics of latitude and longitude points falling into each school district, wherein the number of persons corresponding to the longitudes and latitudes are the number of the school-age children in the corresponding area, and finally displaying the school district information and the statistics data. Compared to the prior art, the method for constructing the school district pressure model through adoption of the map technology, the method can assist schools in effectively perform pre-prediction of the number of the school-age children so as to greatly reduce the work cost of artificial statistics and effectively improve the efficiency of calculation and statistics of the number of the school-age children.

Description

technical field [0001] The invention relates to the field of big data analysis and visualization, in particular to a method for constructing a school district pressure model using map technology. Background technique [0002] Using maps to visually display region-related data is a very common method in big data visualization technology in recent years. The combination of maps and regional data can reflect the laws of data more intuitively and truly. Map-based secondary development is also favored by many big data R&D personnel. By calling the API provided by the map and customizing the development according to their own needs, the map can be better combined with business scenarios. [0003] The division of school districts is one of the most concerned people's livelihood hotspots in every city. In order to better allocate and balance the number of teachers, the Education Bureau will conduct a thorough statistics of school-age children in each school district before entering ...

Claims


Application Information

Patent Timeline
IPC IPC(8): G06Q50/20G06F17/30G06Q10/06G09B29/00
CPCG06F16/29G06Q10/067G06Q50/205G09B29/007
Inventor 王晓芹张晓磊李锦峰许东慧
Owner SHANDONG INSPUR CLOUD SERVICE INFORMATION TECH CO LTD
Why Eureka
Try Eureka