Method for inverting carbon dioxide flooding frontal edge by multi-point continuous pressure measurement data

A carbon dioxide and data inversion technology, applied in the direction of electrical digital data processing, special data processing applications, measurement, etc., can solve the problems of development and management lag, inability to obtain continuous changes in carbon dioxide displacement fronts, serious gas channeling, etc.

Active Publication Date: 2017-11-24
CHINA PETROLEUM & CHEM CORP +1
View PDF3 Cites 6 Cited by
  • Summary
  • Abstract
  • Description
  • Claims
  • Application Information

AI Technical Summary

Problems solved by technology

However, the numerical simulation technology requires high data and long simulation period; the cross-well microseismic method and the cross-well tracer test method are costly, and it is difficult to describe the change of the carbon dioxide front in the early stage of gas channeling, and it is impossible to obtain the continuity of the carbon dioxide displacement front. Changes
[0003] Due to the inability to accurately and timely describe the continuous changes of the carbon dioxide displacement front, the current carbon dioxide flooding development of low-permeability reservoirs has serious gas channeling, poor development effects, lack of basis for timely adjustment of the working system, and lagging development management

Method used


Image

  • Method for inverting carbon dioxide flooding frontal edge by multi-point continuous pressure measurement data
  • Method for inverting carbon dioxide flooding frontal edge by multi-point continuous pressure measurement data
  • Method for inverting carbon dioxide flooding frontal edge by multi-point continuous pressure measurement data

Examples


Embodiment 1

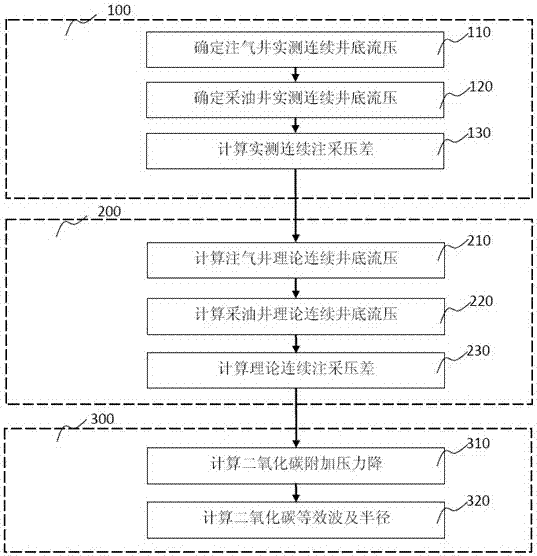
[0097] Such as figure 1 as shown, figure 1 It is a flow chart of the method for inverting the carbon dioxide flooding front by using multi-point continuous pressure measurement data of the present invention.

[0098] In step 100, the measured continuous injection-production pressure difference is calculated, and the specific steps include the step 110 of determining the measured continuous bottomhole flowing pressure of the gas injection well, the step 120 of determining the measured continuous bottomhole flowing pressure of the oil production well, and the step 130 of calculating the measured continuous injection-production pressure difference.

[0099] The measured continuous injection-production pressure difference Δp h (t) refers to the measured continuous bottomhole flowing pressure p of the gas injection well inj-h (t) and the measured continuous bottomhole flowing pressure p pro-h (t) difference, the definition formula is:

[0100] Δp h (t)=p inj-h (t)-p pro-h (t...

Embodiment 2

[0158] Example 2: Comparison of Calculation Results of Carbon Dioxide Equivalent Sweep Radius and Numerical Simulation Technology

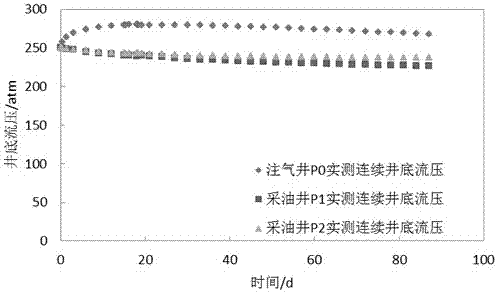
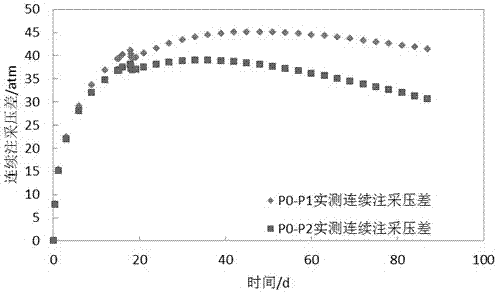
[0159] The validity of the well testing method for pressure difference instability between injection and production wells was verified by using the composition theory model. The theoretical model of components is designed, the plane size of the geological model is 999m×999m, the grid dimension is 111×111×3=36963, and the grid size is 9m×9m×5m. The grid in the area of ​​180m×180m near the wellbore is densified, the dimension of the densified grid is 123×123×3=45387, and the size of the densified grid is 3m×3m×1m. The model is a five-point well pattern. There are channeling channels between production wells P1, P3, P2, and P4 and gas injection well P0, and the permeability is 25, 100×10 ‐3 μm 2 .

[0160] ①Calculation of measured continuous injection-production pressure difference

[0161] The measured bottomhole flowing pressure of gas injectio...


PUM


Abstract

The invention provides a method for inverting a carbon dioxide flooding frontal edge by multi-point continuous pressure measurement data. The method for inverting the carbon dioxide flooding frontal edge by the multi-point continuous pressure measurement data comprises the steps that 1, the actually measured continuous bottom-hole flowing pressure of a gas injection well and an oil production well are determined, and an actual measured continuous injection-production pressure difference is calculated according to the actually measured continuous bottom-hole flowing pressure of the gas injection well and the oil production well; 2, the theoretical continuous bottom-hole flowing pressure of the gas injection well and the oil production well are calculated, and a theoretical continuous injection-production pressure difference is calculated according to the theoretical continuous bottom-hole flowing pressure of the gas injection well and the oil production well; and 3, a carbon dioxide additional pressure drop is calculated according to the actually measured and the theoretical continuous injection-production pressure difference, and the equivalent wave and the radius of carbon dioxide are inverted. The method for inverting the carbon dioxide flooding frontal edge by the multi-point continuous pressure measurement data is accurate in result and easy to implement, and has significant meaning on improving the exploitation effect of carbon dioxide flooding and achieving scientific management of carbon dioxide flooding reservoirs.

Description

technical field [0001] The invention relates to the field of evaluation of carbon dioxide flooding fronts in oil and gas field development, in particular to a method for inverting carbon dioxide flooding fronts by using multi-point continuous pressure measurement data. Background technique [0002] Carbon dioxide flooding shows unique advantages in solving low permeability reservoir development. During the field test, it is reflected that carbon dioxide flooding has strong gas channeling characteristics, and the potential tapping effect varies greatly, and it is difficult to quantify it purely from the perspective of carbon dioxide output. Therefore, it is necessary to accurately describe the distribution of subsurface carbon dioxide displacement fronts from the perspective of field measurements. The commonly used methods include numerical simulation technology, cross-well microseismic method and cross-well tracer test method. However, the numerical simulation technology r...

Claims


Application Information

Patent Timeline
Patent Type & Authority Applications(China)
IPC IPC(8): E21B43/16E21B47/06G06F19/00
Inventor 李友全阎燕于伟杰张奎祥张德志王杰高安邦薛元真韩凤蕊李弘博郭建福赵辉岳小华黄成江
Owner CHINA PETROLEUM & CHEM CORP
Why Eureka
Try Eureka