Wireless sensor network abnormal node detecting and positioning method based on subgraph processing
A wireless sensor and sensor node technology, applied in network topology, wireless communication, data exchange network and other directions, can solve the problem of low detection rate of detection methods and achieve the effect of high detection rate
- Summary
- Abstract
- Description
- Claims
- Application Information
AI Technical Summary
Problems solved by technology
Method used
Image
Examples
example 1
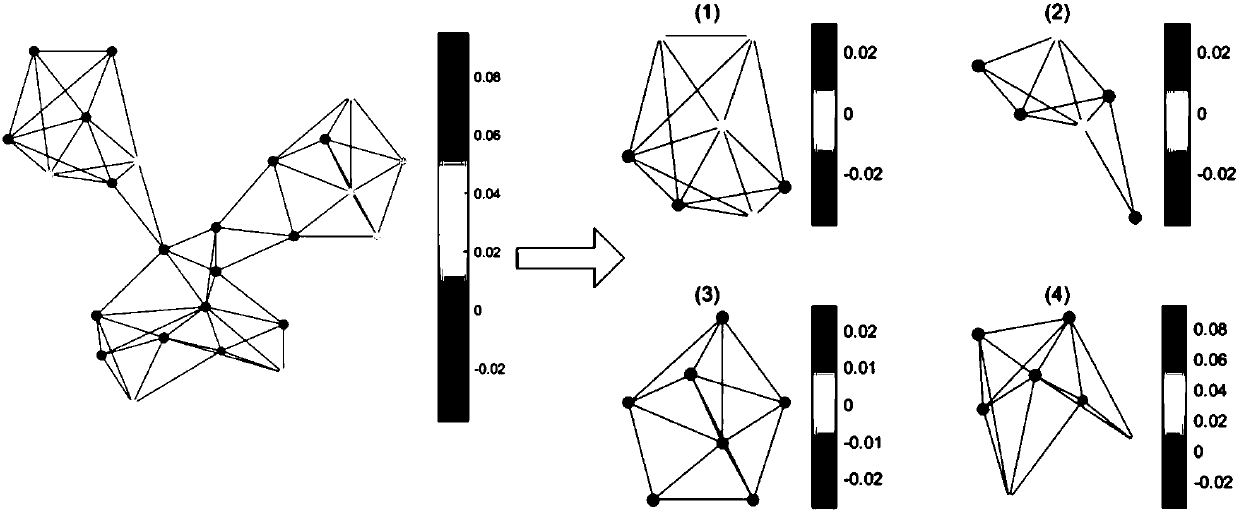
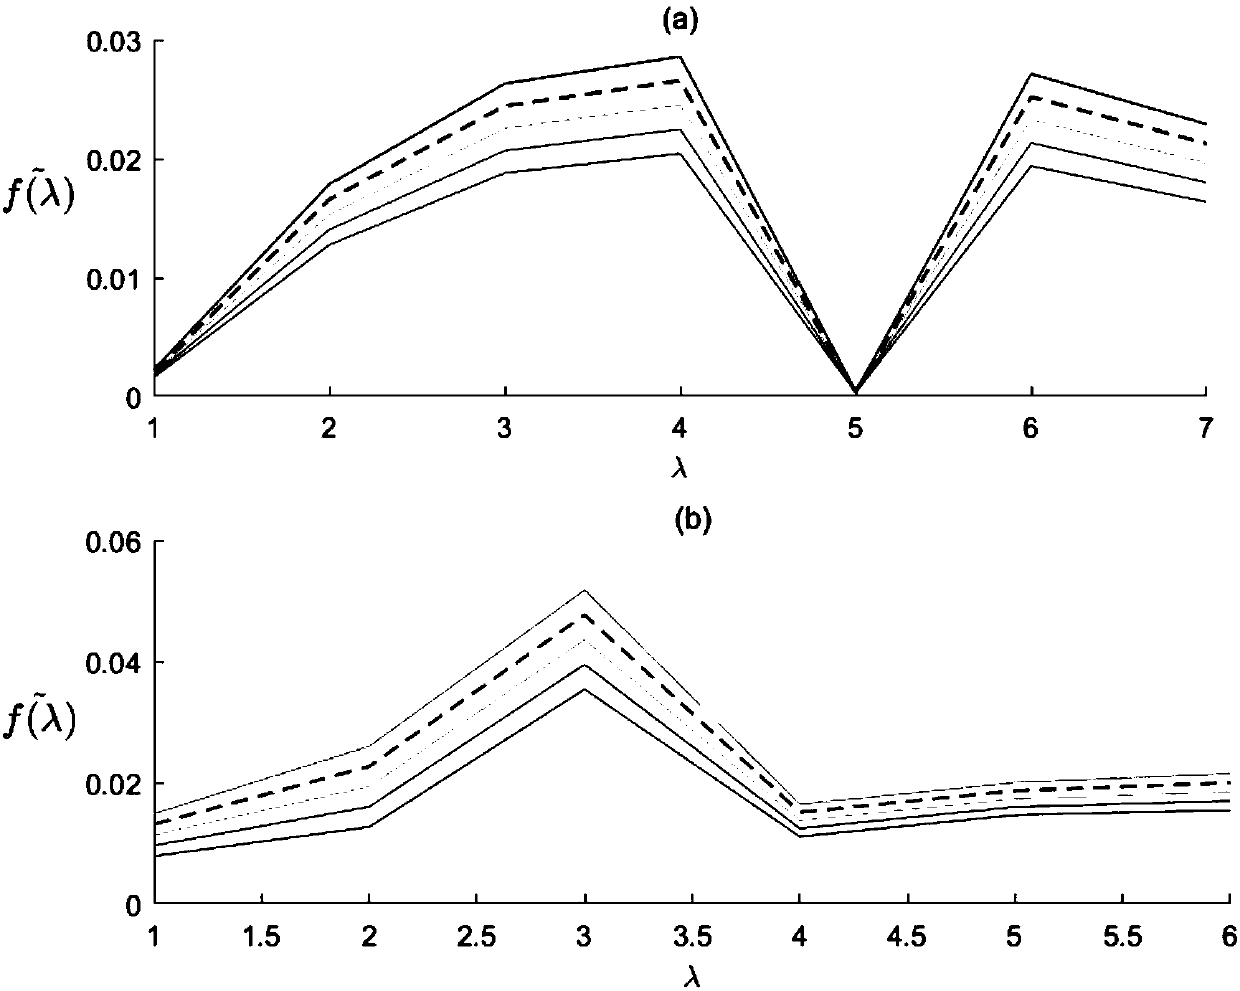
[0073] Figure 4 It is the network diagram of the average temperature network of major cities in the United States in 2003 used in Example 1. The data set of the experiment is the daily average temperature of major cities in the United States in 2003. The data set collected the daily average temperature of 150 cities for 365 days. The value is 43.25°F. The number of nodes in the network is 150, and we connect each node with the 6 nodes with the closest geographical distance (Q=6), and then conduct anomaly detection experiments and simulations in four different abnormal situations. In the first and second groups, each experiment increases the temperature of a certain sensor of one day by 20°F or is set to 0°F. Since the present invention needs four days of historical data, when τ takes different values in two groups of simulations, The number of tests is 54150 times (150×361), and the simulation results are shown in Table 1 and Table 2. In the third and fourth cases, we ra...
example 2
[0084] Figure 5 It is the temperature sensor network diagram at a certain moment of the global sea level measurement stations used in Example 2. The data collection is the data collection of the temperature of some sea level measurement stations around the world, with a total of 100 measurement stations and 1733 data collected at time. The range of the data set is from -0.01°C to 30.72°C, and the average value of the data is 19.15°C. In each case, the number of experiments and exception settings are 50,000, but the increased temperature value is 5°C. The experimental simulation results in four different cases are recorded in Table 5 to Table 8, respectively.
[0085] Table 5 Detection indicators when the signal value of a single node in the surface network of some global sea level measurement stations increases abnormally
[0086]
[0087] Table 6 The detection index when the signal value of a single node in the surface network of some global sea level measurement stati...
PUM
 Abstract
Description
Claims
Application Information
 - R&D
- Intellectual Property
- Life Sciences
- Materials
- Tech Scout
- Unparalleled Data Quality
- Higher Quality Content
- 60% Fewer Hallucinations
Browse by: Latest US Patents, China's latest patents, Technical Efficacy Thesaurus, Application Domain, Technology Topic, Popular Technical Reports.
© 2025 PatSnap. All rights reserved.Legal|Privacy policy|Modern Slavery Act Transparency Statement|Sitemap|About US| Contact US: help@patsnap.com


