
Visualization method for multi-attribute comparison of detection data of pesticide residues

A technology for detecting data and data attributes, which is applied in the fields of electrical digital data processing, special data processing applications, biological testing, etc., and can solve problems such as lack of pesticide residue detection data

Inactive Publication Date: 2018-04-03
BEIJING TECHNOLOGY AND BUSINESS UNIVERSITY
View PDF3 Cites 4 Cited by
  • Summary
  • Abstract
  • Description
  • Claims
  • Application Information

AI Technical Summary

Problems solved by technology

[0006] The purpose of the present invention is to solve the problem that the current pesticide residue detection data lacks a visualization method to realize the simultaneous comparison of multiple attributes, and propose a multi-attribute comparison visualization method for the pesticide residue detection data

Method used


Image

  • Visualization method for multi-attribute comparison of detection data of pesticide residues
  • Visualization method for multi-attribute comparison of detection data of pesticide residues
  • Visualization method for multi-attribute comparison of detection data of pesticide residues

Examples


Embodiment

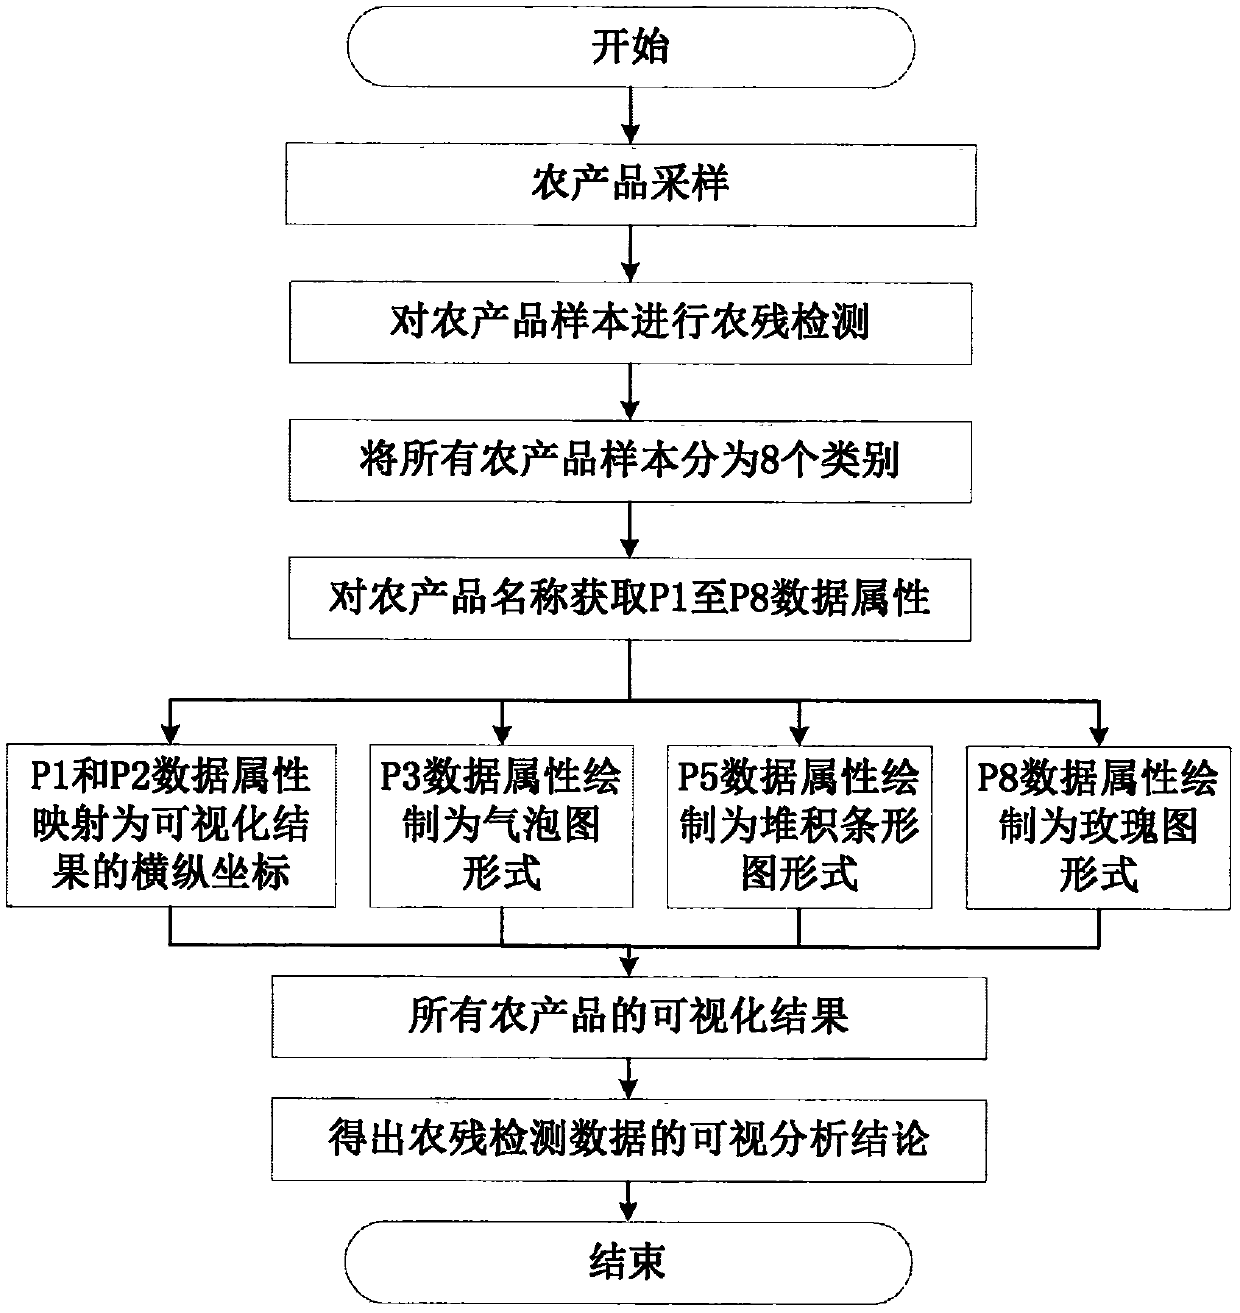
[0091] This embodiment describes the implementation flow chart of a multi-attribute comparison and visualization method for pesticide residue detection data proposed in the present invention based on an agricultural product.

[0092] Such as figure 1 As shown in , it is an implementation process of a multi-attribute comparison and visualization method for pesticide residue detection data.

[0093] From figure 1 It can be seen that the specific operation process is as follows:

[0094] Step A: Sampling of agricultural products;

[0095] Specific to the sample sampling of agricultural products in this embodiment, four kinds of agricultural products of orange, pear, tangerine and apple are sampled within 4 time periods in a certain area;

[0096] Step B: Perform pesticide residue detection on agricultural product samples;

[0097] Specific to this embodiment, all agricultural products are sampled and tested for pesticide residues in turn to obtain a dataset of pesticide res...


PUM


Abstract

The invention relates to a visualization method for multi-attribute comparison of detection data of pesticide residues, belonging to the technical fields of computer graphics and visualization. The method comprises the following steps: 1, sampling a plurality of to-be-detected agricultural products so as to obtain samples of the agricultural products; 2, successively detecting pesticide residues in the samples to obtain detection results of pesticide residues; 3, classifying the detection results of pesticide residues; 4, concentratedly acquiring data attributes as described in P1 to P8 from the detection data of pesticide residues; 5, carrying out mapping of horizontal and vertical coordinates on the visualization results of the agricultural products; 6, displaying the total sampling amount of different agricultural products by using a bubble diagram; 7, drawing stacked bar charts for the numbers of pesticide-detected samples of corresponding agricultural products in different time periods; 8, drawing the rose diagram of the pesticide residue detection results of all the agricultural products in all the time periods so as to realize visualization effect of the detection data of pesticide residues; and 9, carrying out multi-attribute comparison to obtain the conclusion of visualization analysis. The method provided by the invention realizes simple visual multi-attribute visualization analysis with multiple statistical magnitudes in the three aspectis of time dimensions, pesticides and agricultural products.

Description

technical field [0001] The invention relates to a multi-attribute comparison and visualization method for pesticide residue detection data, which belongs to the technical field of computer graphics and visualization. Background technique [0002] Pesticide chemical pollutant residues in edible agricultural products are one of the main unsafe factors affecting the safety of agricultural products, and the detection data of pesticide chemical pollutant residues in edible agricultural products (referred to as pesticide residue detection) is an important data for safety assessment of edible agricultural products. Each detection record in the detection data consists of multiple attributes, including the name of the agricultural product sample, the number of samples of the agricultural product sample, the category of the agricultural product, the detection time, the amount of pesticide detected, etc. [0003] When evaluating the safety of agricultural products, multiple batches of ...

Claims


Application Information

Patent Timeline
Patent Type & Authority Applications(China)
IPC IPC(8): G01N33/48G06F17/30
CPCG01N33/48G06F16/358
Inventor 陈红倩杨倩玉方艺许继平刘瑞军
Owner BEIJING TECHNOLOGY AND BUSINESS UNIVERSITY
Learn More