Audio similarity determination method and apparatus, and storage medium
A technology for determining methods and similarities, applied in the field of communication, can solve problems such as inapplicability, inability to extract MIDI feature files, and narrow applicability of existing solutions, so as to achieve the effect of improving applicability
- Summary
- Abstract
- Description
- Claims
- Application Information
AI Technical Summary
Problems solved by technology
Method used
Image

Examples
Embodiment 1
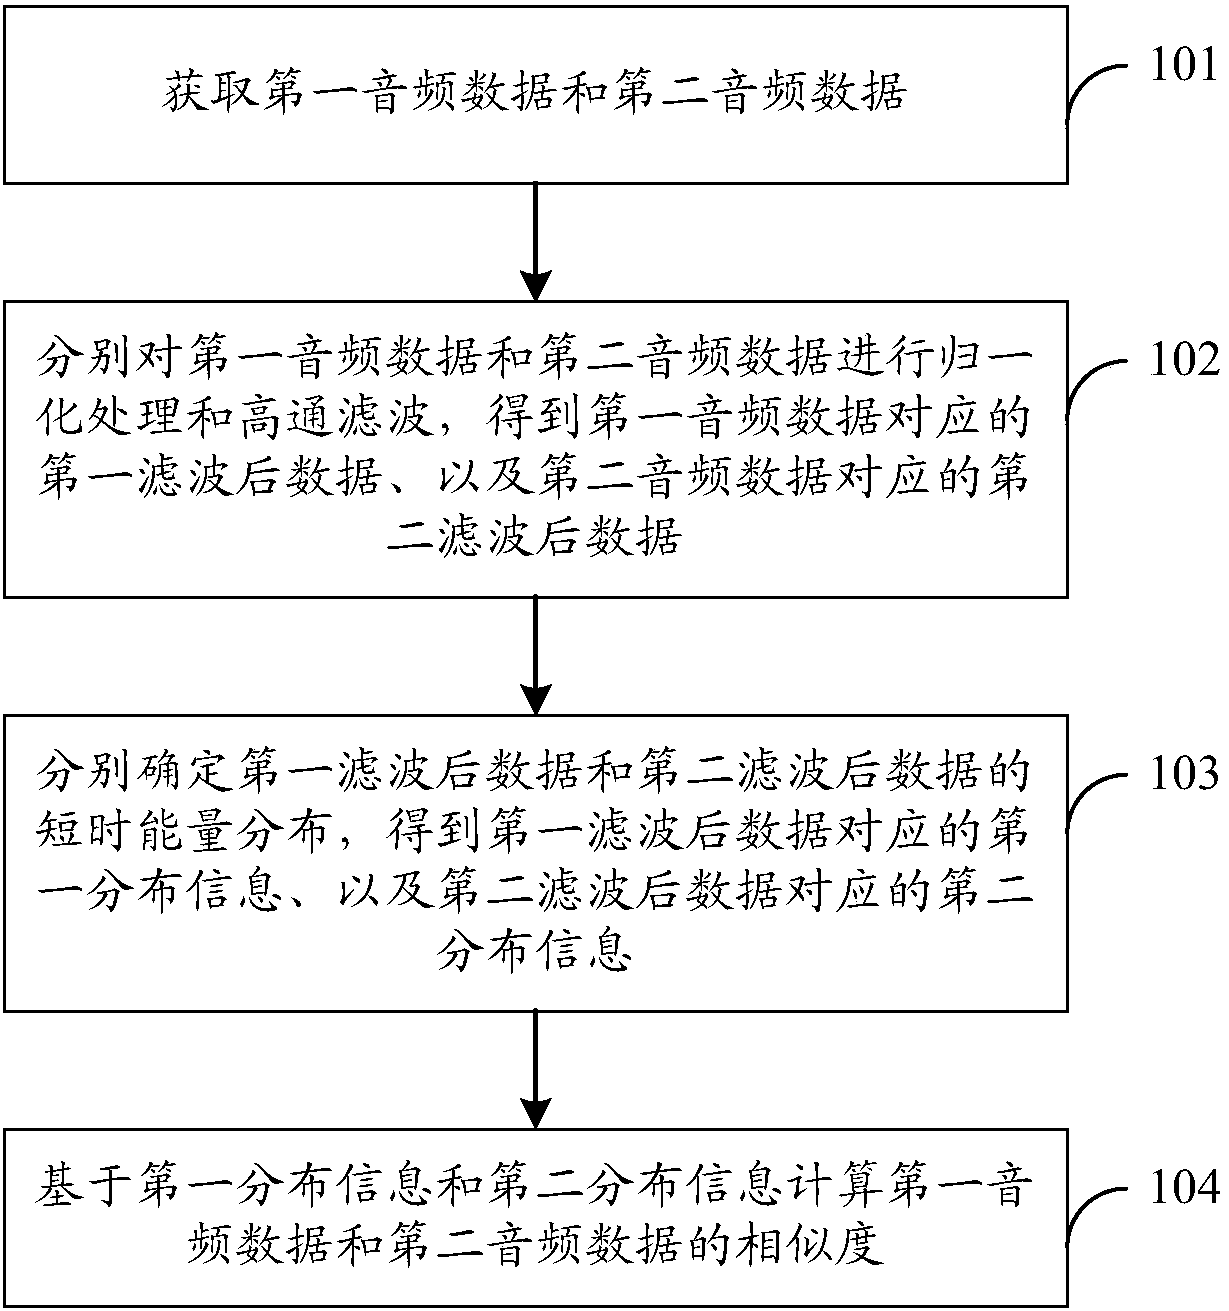
[0042] In this embodiment, description will be made from the perspective of an apparatus for determining audio similarity, and the apparatus for determining audio similarity may specifically be integrated in a server or other device.
[0043] A method for determining audio similarity, comprising: acquiring first audio data and second audio data; respectively performing normalization processing and high-pass filtering on the first audio data and the second audio data to obtain the first audio data corresponding to the first audio data. One filtered data, second filtered data corresponding to the second audio data, and determining short-term energy distributions of the first filtered data and the second filtered data respectively, to obtain first distribution information corresponding to the first filtered data , second distribution information corresponding to the second filtered data; calculating the similarity between the first audio data and the second audio data based on the...
Embodiment 2
[0131] According to the methods implemented in the foregoing embodiments, examples will be given below for further detailed description.
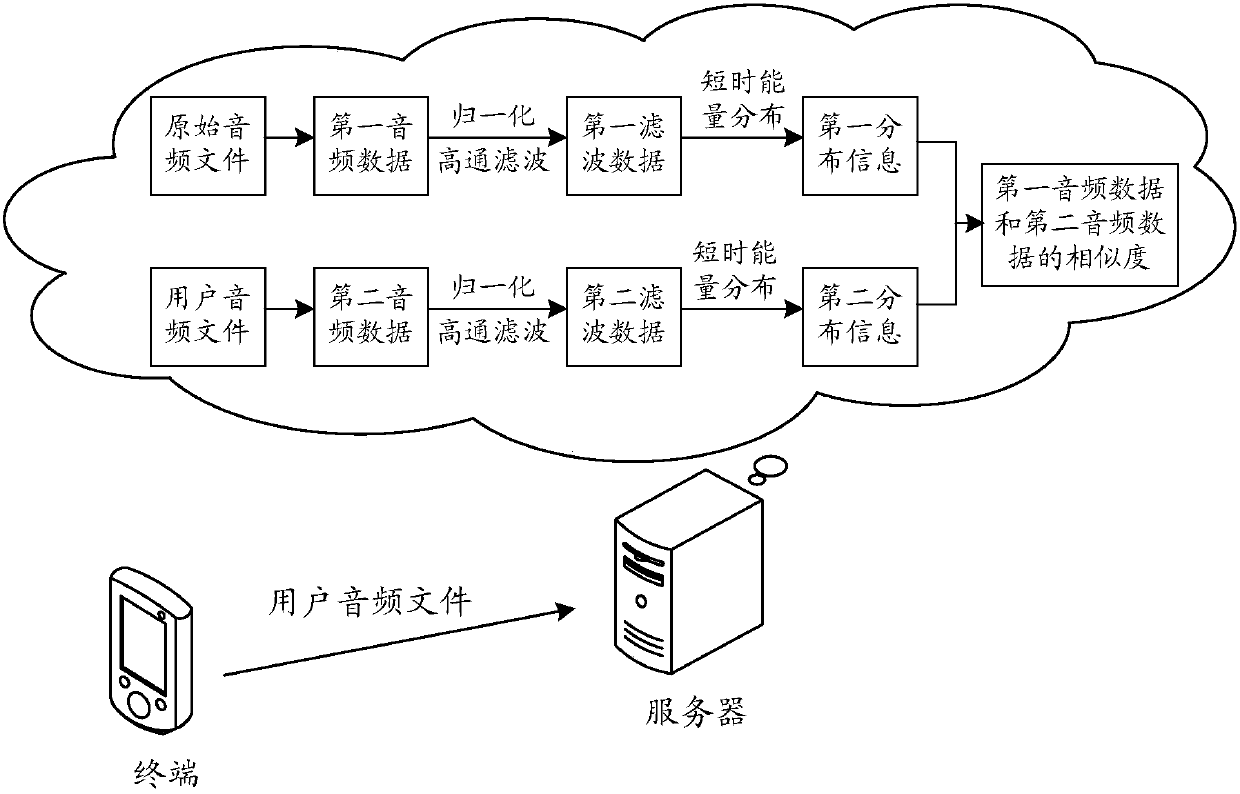
[0132] In this embodiment, the device for determining the audio similarity is integrated in the server, the first audio file is an original audio file (ie original dubbing file), and the second audio file is a user audio file as an example for illustration.
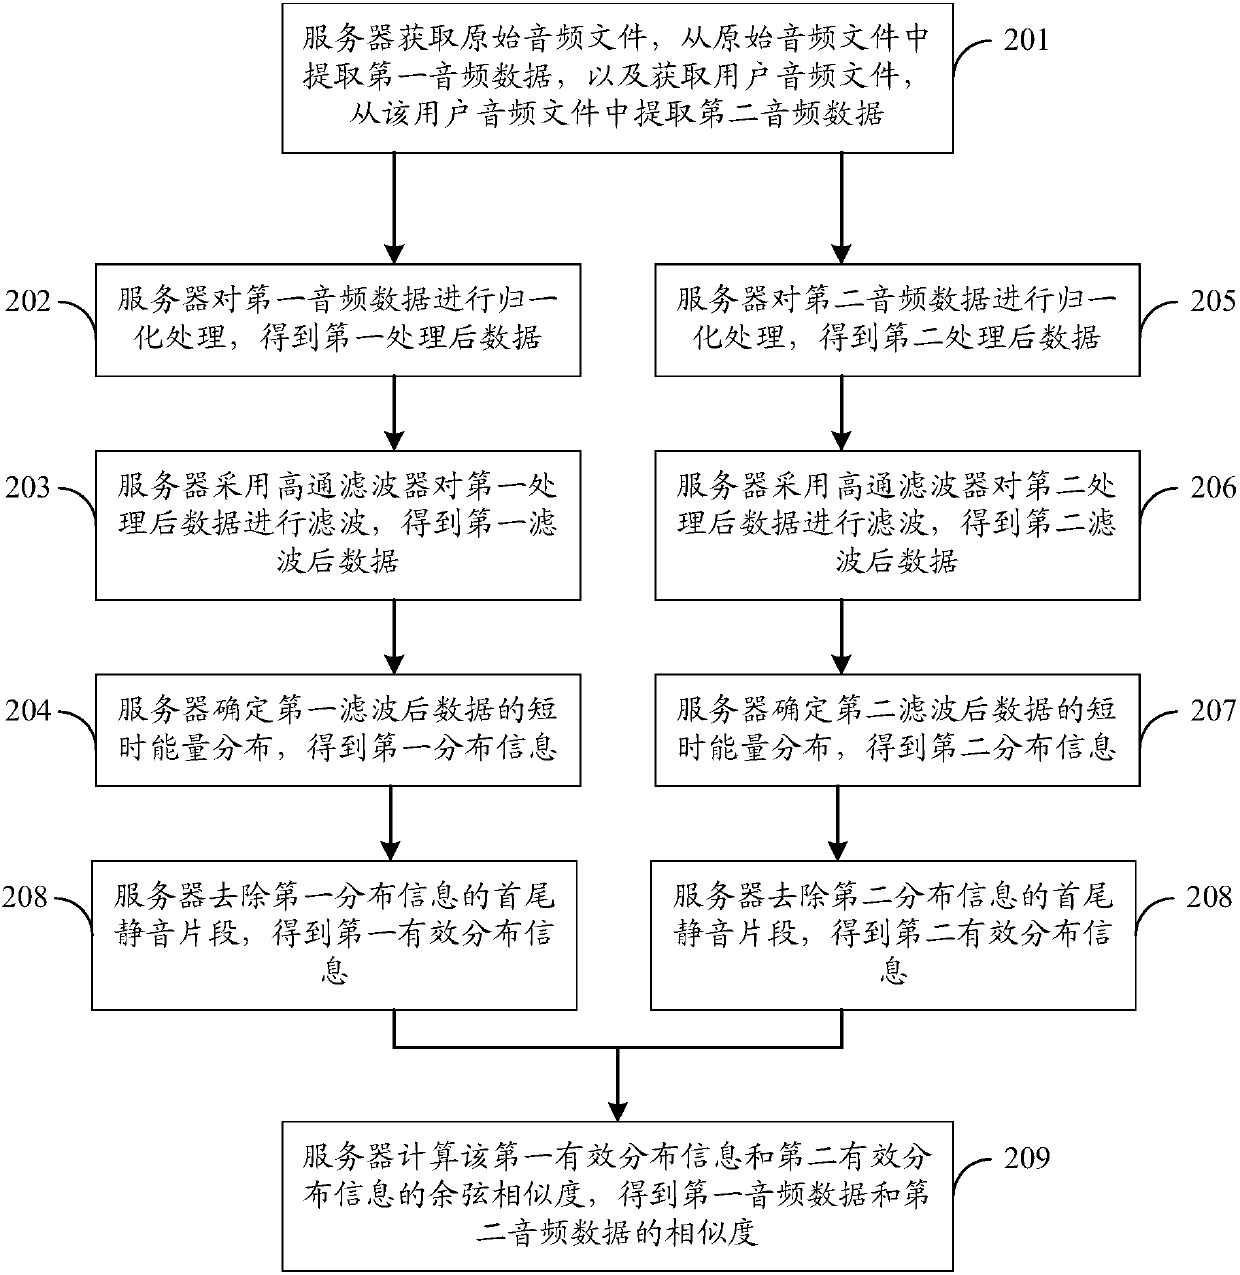
[0133] Such as Figure 2a As shown, a method for determining audio similarity, the specific process can be as follows:
[0134] 201. The server acquires an original audio file, extracts first audio data from the original audio file, acquires a user audio file, and extracts second audio data from the user audio file.
[0135]For example, after the server obtains the original audio file, it can transcode the original audio file according to the preset transcoding strategy, for example, convert the original audio file into wav uncompressed format, and transcode the original audio file ac...
Embodiment 3
[0208] In order to better implement the above method, an embodiment of the present invention further provides an audio similarity determination apparatus, and the audio similarity determination apparatus may specifically be integrated in a server or other equipment.
[0209] For example, if Figure 3a As shown, the device for determining the audio similarity may include an acquisition unit 301, a first processing unit 302, a second processing unit 303, and a calculation unit 304, as follows:
[0210] (1) acquisition unit 301;
[0211] An acquiring unit 301, configured to acquire first audio data and second audio data.
[0212] For example, the obtaining unit 301 may be specifically configured to obtain a first audio file, extract the first audio data from the first audio file, and obtain a second audio file, and extract the second audio data from the second audio file, wait.
[0213] Optionally, in order to reduce interference, reduce the difference between audio files caus...
PUM
 Abstract
Description
Claims
Application Information
 - Generate Ideas
- Intellectual Property
- Life Sciences
- Materials
- Tech Scout
- Unparalleled Data Quality
- Higher Quality Content
- 60% Fewer Hallucinations
Browse by: Latest US Patents, China's latest patents, Technical Efficacy Thesaurus, Application Domain, Technology Topic, Popular Technical Reports.
© 2025 PatSnap. All rights reserved.Legal|Privacy policy|Modern Slavery Act Transparency Statement|Sitemap|About US| Contact US: help@patsnap.com