Power supply enterprise customer satisfaction evaluation method based on partial least square method

A technology based on partial least squares and enterprise customers, applied in the field of power supply enterprise customer satisfaction evaluation method and computing equipment based on partial least squares, can solve the problems of few applications, no model verification, only applicable customer satisfaction index, etc. , to achieve the effect of ensuring practicality and improving accuracy

Inactive Publication Date: 2018-08-24
STATE GRID LIAONING ELECTRIC POWER CO LTD SHENYANG POWER +5
0 Cites 2 Cited by

AI-Extracted Technical Summary

Problems solved by technology

As far as China is concerned, although some research has been done on user satisfaction, there are still many problems: First, the research on Chinese user satisfaction is qualitative and can only help companies establish a user-centered management concept. The implementability and maneuverability of the index are not very strong; secondly, China's national customer satisfaction index is only applicable to a few industries such ...

Method used

[0086] PLS regression is a new method of multi-analysis, which was introduced in Sweden in 1983 by S.Wold and C.Albano, and is mainly applied to the regression model between more attribute variables and more independent variables. The PLS regression method can solve the following problems: First, it eliminates the multicollinearity similar to PCR, but it not only extracts the common components of independent variables and attribute variables, but also records the information about independent variables and attribute varia...

Abstract

The invention discloses a power supply enterprise customer satisfaction evaluation method based on a partial least square method and also a computing device. The method includes the following steps: acquiring user satisfaction index variables, wherein the user satisfaction index variables comprise a plurality of latent variables and observational variables; building an internal model on the basisof all the latent variables, wherein the internal model represents internal relations among the latent variables through regression coefficients; constructing an external model based on the latent variables and the corresponding observational variables, wherein the external model represents external relations among the latent variables and the corresponding observational variables through load coefficients; calculating load coefficients in the external model and regression coefficients in the internal model; and updating the external model and the internal model according to the load coefficients and the regression coefficients, and combining the updated external model and the updated internal model to form a user satisfaction model so as to evaluate satisfaction of electric power users.

Application Domain

ResourcesMarket data gathering

Technology Topic

User satisfactionLeast squares +5

Image

  • Power supply enterprise customer satisfaction evaluation method based on partial least square method
  • Power supply enterprise customer satisfaction evaluation method based on partial least square method
  • Power supply enterprise customer satisfaction evaluation method based on partial least square method

Examples

  • Experimental program(1)

Example Embodiment

[0034] Hereinafter, exemplary embodiments of the present disclosure will be described in more detail with reference to the accompanying drawings. Although exemplary embodiments of the present disclosure are shown in the drawings, it should be understood that the present disclosure can be implemented in various forms and should not be limited by the embodiments set forth herein. On the contrary, these embodiments are provided to enable a more thorough understanding of the present disclosure and to fully convey the scope of the present disclosure to those skilled in the art.
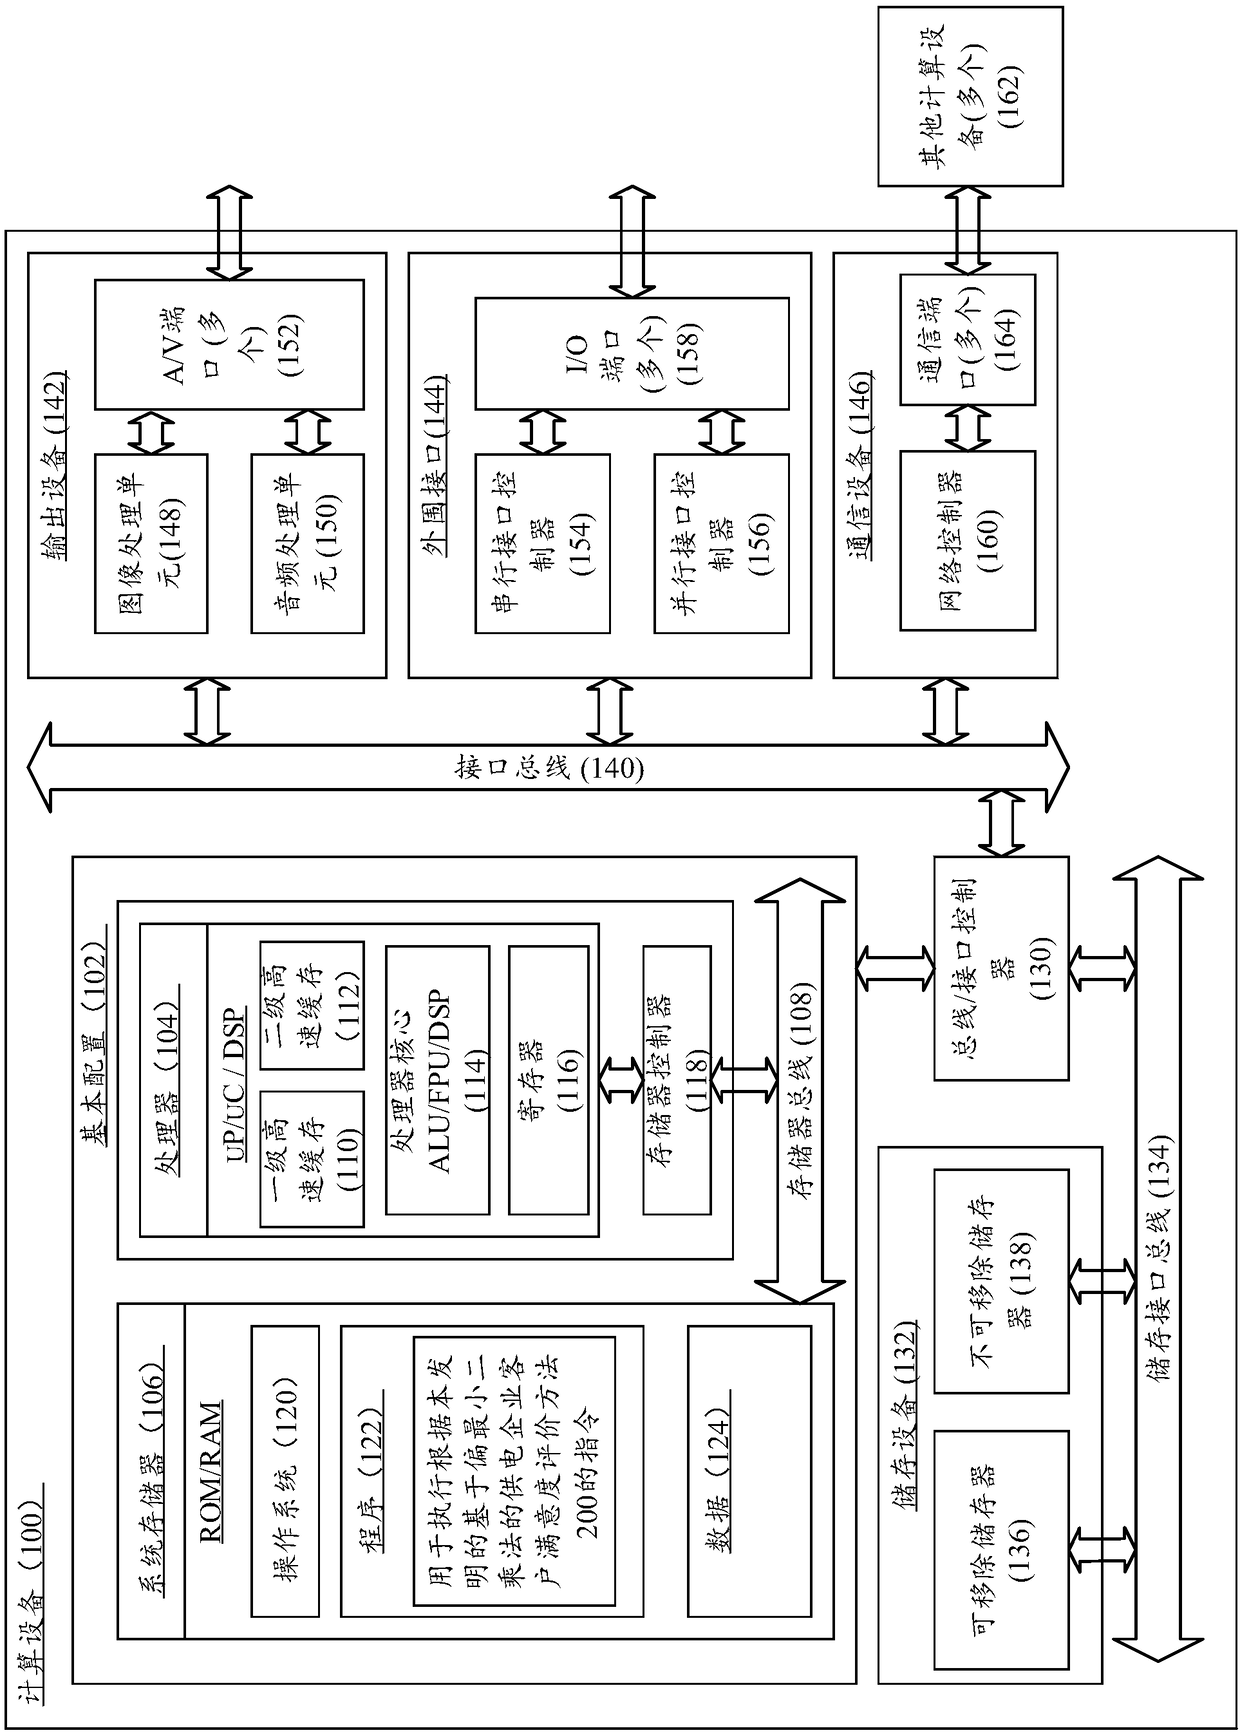
[0035] figure 1 Is a block diagram of an example computing device 100. In the basic configuration 102, the computing device 100 typically includes a system memory 106 and one or more processors 104. The memory bus 108 may be used for communication between the processor 104 and the system memory 106.
[0036] Depending on the desired configuration, the processor 104 may be any type of processing, including but not limited to: microprocessor (μP), microcontroller (μC), digital information processor (DSP), or any combination thereof. The processor 104 may include one or more levels of cache, such as the first level cache 110 and the second level cache 112, the processor core 114, and the registers 116. The exemplary processor core 114 may include an arithmetic logic unit (ALU), a floating point number unit (FPU), a digital signal processing core (DSP core), or any combination thereof. The exemplary memory controller 118 may be used with the processor 104, or in some implementations, the memory controller 118 may be an internal part of the processor 104.
[0037] Depending on the desired configuration, the system memory 106 may be any type of memory, including but not limited to: volatile memory (such as RAM), non-volatile memory (such as ROM, flash memory, etc.), or any combination thereof. The system memory 106 may include an operating system 120, one or more programs 122, and program data 124. In some embodiments, the program 122 may be arranged to be executed by one or more processors 104 using program data 124 on an operating system.
[0038] The computing device 100 may also include an interface bus 140 that facilitates communication from various interface devices (eg, output device 142, peripheral interface 144, and communication device 146) to the basic configuration 102 via the bus/interface controller 130. The exemplary output device 142 includes a graphics processing unit 148 and an audio processing unit 150. They can be configured to facilitate communication with various external devices such as displays or speakers via one or more A/V ports 152. The example peripheral interface 144 may include a serial interface controller 154 and a parallel interface controller 156, which may be configured to facilitate communication via one or more I/O ports 158 and input devices such as keyboards, mice, pens, etc. , Voice input devices, touch input devices) or other peripherals (such as printers, scanners, etc.) to communicate. The example communication device 146 may include a network controller 160, which may be arranged to facilitate communication with one or more other computing devices 162 via a network communication link via one or more communication ports 164.
[0039] A network communication link may be an example of a communication medium. The communication medium may generally be embodied as computer readable instructions, data structures, and program modules in a modulated data signal such as a carrier wave or other transmission mechanism, and may include any information delivery medium. A "modulated data signal" can be a signal in which one or more of its data sets or its change can be carried out in a way of encoding information in the signal. As a non-limiting example, communication media may include wired media such as a wired network or a dedicated line network, and various wireless media such as sound, radio frequency (RF), microwave, infrared (IR), or other wireless media. The term computer readable media used herein may include both storage media and communication media.
[0040] The computing device 100 can be implemented as a server, such as a file server, a database server, an application server, and a WEB server, etc., and can also be implemented as a part of a small-sized portable (or mobile) electronic device, such as a cellular phone, a personal digital Assistants (PDAs), personal media player devices, wireless web browsing devices, personal headsets, application-specific devices, or hybrid devices that can include any of the above functions. The computing device 100 may also be implemented as a personal computer including desktop computer and notebook computer configurations.
[0041] In some embodiments, the computing device 100 is configured to execute the method 200 for evaluating customer satisfaction of power supply enterprises based on the partial least square method according to the present invention. Wherein, one or more programs 122 of the computing device 100 include instructions for executing the method 200 for evaluating customer satisfaction of power supply enterprises based on the partial least square method according to the present invention.
[0042] figure 2 A flowchart of a method 200 for evaluating customer satisfaction of a power supply enterprise based on the partial least square method according to an embodiment of the present invention is shown. The customer satisfaction evaluation method 200 of power supply enterprises based on partial least squares method is suitable for computing equipment (e.g. figure 1 In the illustrated computing device 100).
[0043] Such as figure 2 As shown, the method 200 starts at step S210. In step S210, a user satisfaction index variable is obtained. The user satisfaction index variable includes multiple latent variables and observation variables. Among them, a latent variable generally corresponds to one or more observed variables related to it. Through user satisfaction index variables, it should be possible to construct a user satisfaction evaluation system for power supply companies, which has the following four characteristics:
[0044] 1) Comprehensiveness: should reflect the main aspects that affect customer satisfaction;
[0045] 2) Independence: It must be highly distinguishable and easy to identify;
[0046] 3) Comparability: The evaluations of different companies or the same company at different times are comparable, and they are fair to every object with no tendency;
[0047] 4) Feasibility: The ultimate goal is to develop factors that affect user satisfaction, so as to develop improvement strategies and improve user satisfaction. Therefore, the content and meaning of the indicators must be understood by workers and users.
[0048] Based on this, according to an embodiment of the present invention, for user satisfaction index variables, the latent variables include exogenous variables and endogenous variables, the exogenous variables are corporate image, and the endogenous variables include expectations, quality perception, and value. At least one of perception, satisfaction, complaint rate and loyalty. Among them, the observed variables corresponding to the corporate image include at least one of being welcomed by customers, paying attention to social welfare undertakings, caring for customers, high-quality power supply, and providing high-level services. The observed variables corresponding to expectations include ideal expectations and/or acceptable expectations. The observed variables corresponding to quality perception include at least one of sensibility, reliability, assurance, responsiveness, humanization, safety and stability, and value perception corresponding Observed variables include the evaluation of service quality under the current electricity price of customers and/or customers who compare the prices of power grid companies and other public utilities. Observed variables corresponding to the degree of satisfaction include overall evaluation, comparison of expectations, comparison of different periods, and comparison with others. At least one type of business comparison, the observed variable corresponding to the complaint rate includes the frequency of customer complaints last year and/or the frequency of litigation after last year's customer complaints, and the observed variable corresponding to loyalty includes any of recommendation, confidence and action.
[0049] Then, step S220 is entered to construct an internal model based on each latent variable, and the internal model represents the internal relationship between the latent variables through regression coefficients. According to an embodiment of the present invention, the internal model is expressed by the following formula:
[0050] F=βF+γX+e (1)
[0051] Among them, F represents the endogenous variable in the latent variable, X represents the exogenous variable in the latent variable, β and γ are the regression coefficients of the internal model, β represents the interaction between the endogenous variables, and γ represents the endogenous variable of the exogenous variable. The influence of the biological variable, e represents the error term of the internal model.
[0052] After the internal model is obtained, in step S230, an external model is constructed based on each latent variable and its corresponding observation variable, and the external model represents the external relationship between each latent variable and its corresponding observation variable through load coefficients. According to an embodiment of the present invention, the external model is expressed by the following formula:
[0053] y=λ y F+e y (2)
[0054] x=λ x X+e x (3)
[0055] Among them, F represents the endogenous variable in the latent variable, X represents the exogenous variable in the latent variable, y represents the observed variable corresponding to the endogenous variable F, x represents the observed variable corresponding to the exogenous variable X, λ y Represents the load coefficient between the endogenous variable F and its corresponding observation variable y, λ x Represents the load coefficient between the exogenous variable X and its corresponding observation variable x, e y And e x Respectively represent the corresponding error terms in the external model.
[0056] In this embodiment, for formulas (1), (2) and (3), the endogenous variable F is the expected F 1 , Quality perception F 2 , Value perception F 3 , Satisfaction F 4 , Complaint rate F 5 And loyalty F 6 The column vector formed by the combination, the observed variable y corresponding to the endogenous variable F is the expected F 1 , Quality perception F 2 , Value perception F 3 , Satisfaction F 4 , Complaint rate F 5 And loyalty F 6 The column vector formed by the combination of the corresponding observation variables. Specifically, expect F 1 The corresponding observation variables include ideal expectations y 11 And acceptable expectations 12 , Quality perception F 2 The corresponding observation variables include sensibility y 21 , Reliability 22 , Guarantee y 23 , Responsiveness y 24 , Humanized 25 , Security 26 And stability y 27 , Value perception F 3 The corresponding observation variables include the evaluation of service quality under the current electricity price of customers. 31 , And customers who compare the prices of power grid companies and other utilities are more reasonable 32 , Satisfaction level F 4 The corresponding observation variables include the overall evaluation y 41 , Expectation comparison y 42 , Compare different periods 43 Compared with other businesses 44 , The complaint rate F 5 The corresponding observed variables include the frequency of customer complaints last year y 51 And the frequency of litigation after customer complaints last year 52 , Loyalty F 6 The corresponding observed variables include recommended y 61 , Confidence y 62 And action y 63. The observed variable x corresponding to the exogenous variable X is welcomed by customers x 1 , Pay attention to social welfare x 2 , Caring for Customers x 3 , High quality power supply x 4 And provide high-level services x 5 The column vector formed by the combination.
[0057] Table 1 shows an example of a user satisfaction evaluation system of a power supply enterprise according to an embodiment of the present invention, in which each latent variable and the corresponding observation variable are described, specifically as follows:
[0058]
[0059]
[0060] Table 1
[0061] As shown in formula (1), the regression coefficient β is expressed by the following formula:
[0062]
[0063] Where β 21 Represents quality perception F 2 And expectation F 1 The interaction between β 31 And β 32 Respectively represent value perception F 3 And expectation F 1 , Quality perception F 2 The interaction between β 41 , Β 42 And β 43 Respectively express the degree of satisfaction F 4 And expectation F 1 , Quality perception F 2 , Value perception F 3 The interaction between β 54 Express the complaint rate F 5 And satisfaction F 4 The interaction between β 64 And β 65 Loyalty F 6 And satisfaction F 4 , Complaint rate F 5 interaction between.
[0064] The regression coefficient γ in formula (1) is expressed by the following formula:
[0065]
[0066] Where γ 1 Indicates that the exogenous variable X expects F in the endogenous variable F 1 The impact of, γ 4 Indicates the degree of satisfaction F of the exogenous variable X to the endogenous variable F 4 Impact.
[0067] Further, the error term e of the internal model in formula (1) is expressed by the following formula:
[0068]
[0069] Where e 1 Express the expectation F 1 The corresponding error term, e 2 Represents quality perception F 2 The corresponding error term, e 3 Represents value perception F 3 The corresponding error term, e 4 Express satisfaction level F 4 The corresponding error term, e 5 Express the complaint rate F 5 The corresponding error term, e 6 Express loyalty F 6 The corresponding error term.
[0070] Based on formulas (1), (4), (5) and (6), the internal model is expressed as follows:
[0071]
[0072] According to an embodiment of the present invention, the load factor λ x Expressed by the following formula:
[0073]
[0074] Where λ 1 , Λ 2 , Λ 3 , Λ 4 And λ 5 Respectively indicate that the observed variable x is welcomed by customers x 1 , Pay attention to social welfare x 2 , Caring for Customers x 3 , High quality power supply x 4 And provide high-level services x 5 The effect of exogenous variable X.
[0075] Based on equations (3) and (8), the external model corresponding to the exogenous variable X can be expressed as follows:
[0076]
[0077] Where e x1 , E x2 , E x3 , E x4 , E x5 And e x6 The column vector formed by the combination is the error term e of the external model in equation (3) x ,Respectively indicate that the observed variables x are welcomed by customers x 1 , Pay attention to social welfare x 2 , Caring for Customers x 3 , High quality power supply x 4 And provide high-level services x 5 The corresponding error term.
[0078] According to an embodiment of the present invention, the external model corresponding to the endogenous variable F can be specifically expressed as follows:
[0079]
[0080] Equation (10) is the specific expression form of equation (2), where the load factor λ y Corresponding to the equation (10), the size of the right side of the equation is 20×6, which represents the correlation matrix between the endogenous variable F and its corresponding observation variable y. In the correlation matrix, λ 11 And λ 12 Denote the ideal expectation y 11 And acceptable expectations 12 Expectation F 1 The influence of λ 21 , Λ 22 , Λ 23 , Λ 24 , Λ 25 , Λ 26 And λ 27 Respectively indicate sensibility y 21 , Reliability 22 , Guarantee y 23 , Responsiveness y 24 , Humanized 25 , Security 26 And stability y 27 Perception of quality F 2 The influence of λ 31 And λ 32 Respectively represent the customer's evaluation of service quality under the current electricity price 31 , And customers who compare the prices of power grid companies with other utilities? 32 Perception of value F 3 The influence of λ 41 , Λ 42 , Λ 43 And λ 44 Respectively represent the overall assessment y 41 , Expectation comparison y 42 , Compare different periods 43 Compared with other businesses 44 Satisfaction F 4 The influence of λ 51 And λ 52 Respectively indicate the frequency of customer complaints last year 51 And the frequency of litigation after customer complaints last year 52 Complaint rate F 5 The influence of λ 61 , Λ 62 And λ 63 Respectively indicate recommendation y 61 , Confidence y 62 And action y 63 Loyalty F 6 Impact.
[0081] In addition, the error term e of the external model shown in equation (2) y Corresponding to the column vector with a size of 20×1 on the right side of equation (10), where e 11 And e 12 Denote the ideal expectation y 11 And acceptable expectations 12 The corresponding error term, e 21 , E 22 , E 23 , E 24 , E 25 , E 26 And e 27 Respectively indicate sensibility y 21 , Reliability 22 , Guarantee y 23 , Responsiveness y 24 , Humanized 25 , Security 26 And stability y 27 The corresponding error term, e 31 And e 32 Respectively represent the customer's evaluation of service quality under the current electricity price 31 , And customers who compare the prices of power grid companies with other utilities? 32 The corresponding error term, e 41 , E 42 , E 43 And e 44 Respectively represent the overall assessment y 41 , Expectation comparison y 42 , Compare different periods 43 Compared with other businesses 44 The corresponding error term, e 51 And e 52 Respectively indicate the frequency of customer complaints last year 51 And the frequency of litigation after customer complaints last year 52 The corresponding error term, e 61 , E 62 And e 63 Respectively indicate recommendation y 61 , Confidence y 62 And action y 63 The corresponding error term.
[0082] It should be noted that the combination of formulas (1), (2) and (3) constitutes a structural equation for evaluating user satisfaction, but since the regression coefficient and load coefficient are not calculated at this time, the next step should be The regression coefficients and load coefficients are first solved to update the external model and internal model to form a user satisfaction model.
[0083] In step S240, the load coefficient in the external model and the regression coefficient in the internal model are calculated respectively. According to an embodiment of the present invention, the load coefficient and regression coefficient can be calculated in the following manner. Firstly, through regression analysis, the estimated value of each latent variable is calculated to obtain the estimated value of each latent variable. Then, according to the estimated value of each latent variable, the value of the corresponding observation variable is regressed to calculate the load of the external model. Coefficients and regression coefficients in the internal model. In this embodiment, the method of regression analysis is used. For ease of description, the following describes the process of regression processing first.
[0084] For power supply services, it has the following three characteristics: First, the research object cannot be accurately and directly measured and is a latent variable. Therefore, the regression model has more attribute variables and more independent variables, and most of them are relative. ; Secondly, various indicators indirectly reflect the impact of all parties on user satisfaction; thirdly, the value of these indicators is obtained by a third-party survey.
[0085] Taking into account the above factors, the traditional least squares regression is not applicable. For such problems, previous studies always choose a few variables to obtain results, which leads to loss of information and it is difficult to evaluate the accuracy of regression. In order to avoid multicollinearity, some researchers try to solve this problem by using principal component regression (PCR: Principle Component Regression), but it requires a lot of calculation, and at the same time, considering the big data of the index, this method is not available. Therefore, finally choose the partial least squares (PLS: Partial Least Squares) regression method to realize this process.
[0086] PLS regression is a new method of multiple analysis. It was introduced in Sweden by S. Wold and C. Albano in 1983. It is mainly applied to regression models between more attribute variables and more independent variables. The PLS regression method can solve the following problems: First, it eliminates the multicollinearity similar to PCR, but it not only extracts the common components of independent variables and attribute variables, but also records the information about independent variables and variables ignored in PCR. Information about attribute variables; secondly, the PLS regression method considers both independent variables and attribute variables as functions of latent variables. Therefore, the extracted variables cover most of the information in the data matrix and ensure the correlation; third, you can get To analyze the correlation between different variables; fourth, the PLS regression method can be realized by the expert software SAS (Statistical Analysis System), and research shows that it can achieve a smaller mean square with a small amount of work.
[0087] The idea of ​​PLS ​​regression is to extract common components to build a regression model that meets two conditions. Suppose there are n samples, q attribute variables, named {b 1 ,...,B q }, p independent variables, named {a 1 ,...,A p }. Then we get the data matrix A=[a 1 ,...,A p ] n×p , B=[b 1 ,...,B q ] n×q.
[0088] First, standardize data A and B, such as subtracting the mean, dividing by standard deviation, etc., to get the standardized raw data as follows:
[0089]
[0090]
[0091] Among them, standard represents the standardization of data A and B, D 0 And E 0 Corresponding to the standardized data of A and B, [D 01 ,...,D 0p ] n×p Each item in [a 1 ,...,A p ] n×p The results of various standardized treatments in [E 01 ,...,E 0q ] n×q Each item corresponds to [b 1 ,...,B q ] n×q The results of the standardized processing in each.
[0092] Next, on D 0 And E 0 Extract the first principal component separately, there are:
[0093] t 1 = E 0 w 1 (13)
[0094] u 1 = F 0 c 1 (14)
[0095] Where t 1 And u 1 Respectively D 0 And E 0 The first principal component of w 1 And c 1 Respectively D 0 And E 0 The first principal component axis vector of, can be understood as weight, and ‖w 1 ||=1, ||c 1 ‖=1, ‖·‖ means to find the norm. In the above process of extracting principal components, the following conditions are required:
[0096]
[0097] Among them, Cov means finding the covariance, Var means finding the equation, r means finding the correlation coefficient, and formula (15) shows that t 1 And u 1 The correlation between the most.
[0098] Specifically, we can first solve w by Lagrangian method 1 And c 1 , So that w 1 Is a symmetric matrix D 0 ′E 0 E 0 ′D 0 The eigenvector corresponding to the largest eigenvalue of, c 1 Is a symmetric matrix E 0 ′D 0 D 0 ′E 0 The eigenvector corresponding to the largest eigenvalue of, where D 0 ′ And E 0 ′ Correspond to D 0 And E 0 The transpose matrix of, and then solve t according to equations (13) and (14) 1 And u 1. It should be noted that the Lagrangian method is an existing mature technology and will not be repeated here.
[0099] According to the principal component regression idea, D 0 And E 0 Respectively its principal component t 1 And u 1 Perform regression modeling as follows:
[0100] D 0 = T 1 p 1 +D 1 (16)
[0101] E 0 = U 1 q 1 +E 1 ′ (17)
[0102] E 0 = T 1 r 1 +E 1 (18)
[0103] among them, D 1 , E 1 ′ And E 1 They are the corresponding residual matrix.
[0104] After that, D 0 Middle principal component t 1 Unexplainable residual matrix D 1 As the new D 0 , E 0 Middle principal component t 1 Unexplainable residual matrix E 1 As the new E 0 , Perform iterative regression according to the previous method, and iteratively, until the remaining matrix E 1 The indicated residual meets the accuracy requirement, or the number of principal components has reached the upper limit (initial D 0 The rank of ), the regression processing ends.
[0105] Assuming that there are k principal components at the end, then:
[0106] E 0 = T 1 r 1 +t 2 r 2 +...+t k r k +E k (19)
[0107] Will t 1 And r 1 Recorded as the principal component component and the first axis vector in the first regression, then t 2 And r 2 Are the first principal component component and the first axis vector in the second regression, and so on, t k And r k They are the first principal component component and the first axis vector in the k-th regression.
[0108] Then, for a newly input piece of data J, first calculate each principal component of the data, that is, the corresponding first principal component component of multiple regressions, such as t 1 , T 2 ,..., t k , And then substituting the principal components into equation (19) to calculate the prediction result of the function value corresponding to the data J.
[0109] Applying the above method to the solution of load coefficient and regression coefficient, y in formula (2) corresponds to B, F corresponds to A, x in formula (3) corresponds to B, X corresponds to A, according to the above The processing process performs regression analysis on y and F, x and X, and calculates the latent variables, namely exogenous variable X and endogenous variable F, including expected F 1 , Quality perception F 2 , Value perception F 3 , Satisfaction F 4 , Complaint rate F 5 And loyalty F 6 Estimated value. After that, according to the estimated value of each latent variable and formulas (9), (10) and (7), regression with the value of the corresponding observation variable respectively to calculate the load coefficient λ of the external model y And λ x , And the regression coefficients β and γ in the internal model.
[0110] Finally, step S250 is executed, the external model and the internal model are respectively updated according to the load coefficients and regression coefficients obtained in step S240, and the updated external model and internal model are combined to form a user satisfaction model for power user satisfaction evaluation. According to an embodiment of the present invention, the user satisfaction model obtained after the parameter update can be used for the satisfaction evaluation of power users, and the power supply company can further improve the power supply-related business level through the evaluation results.
[0111] In this embodiment, the load factor λ x And the error term e x In terms of λ 1 , Λ 2 , Λ 3 , Λ 4 And λ 5 The values ​​of are 0.9449, 0.9560, 0.9449, 0.9416 and 0.8866, e x1 , E x2 , E x3 , E x4 , E x5 And e x6 The values ​​of are 0.3274, 0.2934, 0.3274, 0.3368, 0.4625, combined with formula (9), the external model corresponding to the exogenous variable X is:
[0112]
[0113] Formula (20) shows that “focus on social welfare undertakings” has the greatest impact on the variable “corporate image”, with an impact value of 0.9560. "Welcome to customers" and "Care for customers" ranked second, with an impact value of 0.9449, but the difference between the two is small and the error is small, so it is true.
[0114] Load factor λ y And the error term e y In terms of λ 11 , Λ 12 , Λ 21 , Λ 22 , Λ 23 , Λ 24 , Λ 25 , Λ 26 , Λ 27 , Λ 31 , Λ 32 , Λ 41 , Λ 42 , Λ 43 , Λ 44 , Λ 51 , Λ 52 , Λ 61 , Λ 62 And λ 63 The values ​​of are 0.7013, 0.7013, 0.9551, 0.5157, 0.9017, 0.8337, 0.8202, 0.9846, 0.8091, 0.8748, 0.8793, 0.7844, 0.4844, 0.7857, 0.7623, 0.8704, 0.6992, 0.8247, 0.9300 and 0.8398, e 11 , E 12 , E 21 , E 22 , E 23 , E 24 , E 25 , E 26 , E 27 , E 31 , E 32 , E 41 , E 42 , E 43 , E 44 , E 51 , E 52 , E 61 , E 62 And e 63 The values ​​of are 0.7129, 0.7129, 0.2962, 0.8567, 0.4323, 0.5522, 0.5721, 0.1748, 0.5876, 0.4844, 04763, 0.6202, 0.8748, 0.6187, 0.6472, 0.4923, 0.7149, 0.5655, 0.3675 and 0.5428, combined with formula (10) The external model corresponding to the endogenous variable F is:
[0115]
[0116] From equation (21), it can be seen that "ideal expectations" and "acceptable expectations" have the same effect on the variable "expectations". But in fact, this error is large, as high as 0.7129, so this is unrealistic. The reason may be the problem of the data source used. For example, the user who fills in the satisfaction questionnaire is not serious or lacks instructions to cause the data to be distorted. "Safety" is the key to "quality perception", its value is 0.9846, and the corresponding order of influence is "safety", "sensibility", "guarantee", "response ability", "humanity", "stability" "And "reliability". Therefore, it can be concluded that power users do not care about the promises or standards of power supply companies, and are more concerned about comfort, humanization, security and the guarantee of not disturbing life and work. The results are almost error-free and consistent with reality. For "price perception", users are not only concerned about the value of the service, but also about the price-to-performance ratio compared with other public service companies. At the same time, users are more likely to compare it with other industries. "Overall evaluation", "comparison in different periods", and "comparison with other public utilities" have a greater impact on the user satisfaction index than "expectation comparison", allowing users to pay more attention to specific issues rather than expectations. The "frequency of complaints" is much more important than the "frequency of litigation after complaints". If users are dissatisfied, they will complain about the service. If users are not satisfied with the transaction results, they will sometimes lead to litigation. Therefore, the focus of work is on the users' Before complaining escalated into litigation, meet their needs. "Confidence" is very important to power supply companies, it will be transformed into "loyalty", if users are very satisfied, they will be loyal to the company, and loyalty is easily reflected in confidence, they may recommend the power supply company's power supply services to others .
[0117] For regression coefficients β and γ, β 21 , Β 31 , Β 32 , Β 41 , Β 42 , Β 43 , Β 54 , Β 64 And β 65 The values ​​are 1.0098, -0.1207, 0.8761, 0.0508, 0.4347, 0.3645, -0.8955, 1.579, -0.668, γ 1 And γ 4 The values ​​of are 0.9599 and 0.1299, which can be understood as path coefficients between latent variables. First of all, the variables "image", "expectation", "value perception" and "quality perception" have a direct impact on "satisfaction". "Quality perception" is the most important factor, and "value perception" ranks second. "Expectation" has a small effect on "satisfaction", which means that power users are more concerned about service quality. If the service quality is good, they will be satisfied, which also points out the direction of improving the service of power supply companies.
[0118] Secondly, there is a close positive correlation between "corporate image" and "expectation", "expectation" and "quality perception", and "quality perception" and "value perception". The values ​​are 0.9599, 1.0098 and 0.8761 respectively. The satisfaction of certain processes may affect other processes, and for power supply companies, it is important to comprehensively improve their service levels.
[0119] Third, there is a close negative correlation between "expectation" and "value perception". This is because the higher the expectations, the easier it is to be disappointed.
[0120] Finally, the perception of power users has two results. If they are satisfied, they will be loyal to the power supply company, otherwise they will complain about the service. Therefore, it is easy to understand the close negative correlation between "satisfaction" and "complaint rate", "complaint rate" and "loyalty". From the above analysis, the factors that affect user satisfaction can be obtained from the degree of each value, which will guide the power supply company to implement improvement measures.
[0121] The existing power supply enterprise customer satisfaction evaluation methods are not very implementable and operability, and there are certain defects in model verification and path coefficient analysis between variables. According to the technical solution of power supply enterprise customer satisfaction evaluation based on partial least squares method according to the embodiment of the present invention, firstly obtain the user satisfaction index variable, the user satisfaction index variable includes multiple latent variables and observation variables, and then construct based on each latent variable Internal model, build an external model based on each latent variable and its corresponding observation variable, respectively calculate the parameters in the external model and internal model, and substitute the calculated results into the external model and internal model to complete the update. The external model and the internal model are combined to form a user satisfaction model for power user satisfaction evaluation. In the above scheme, the parameter of the internal model is the regression coefficient, and the parameter of the external model is the load coefficient. Regression analysis is used to solve the two types of parameters, the load coefficient and the regression coefficient, which can better characterize each potential in the user satisfaction model. The internal relationship between variables and the external relationship between each latent variable and its corresponding observation variable ensure the practicality, reliability and operability of the model itself. The accuracy of user satisfaction estimation has been greatly improved, and it is also convenient Analyze the factors that affect user satisfaction, and then guide the power supply company to implement improvement measures, pointing out the direction for subsequent improvement of user satisfaction. In addition, the above-mentioned user satisfaction model can be applied to other industries after corresponding changes, with better compatibility, portability and scalability.
[0122] A9. The method described in A7 or 8, the regression coefficient γ is expressed by the following formula:
[0123]
[0124] Where γ 1 Indicates that the exogenous variable X expects F in the endogenous variable F 1 The impact of, γ 4 Indicates the degree of satisfaction F of the exogenous variable X to the endogenous variable F 4 Impact.
[0125] A10. The method according to any one of A6-9, wherein the exogenous variable X is the corporate image, and the corresponding observation variable x is welcomed by customers x 1 , Pay attention to social welfare x 2 , Caring for Customers x 3 , High quality power supply x 4 And provide high-level services x 5 The column vector formed by the combination.
[0126] A11. The method described in A10, the load factor λ x Expressed by the following formula:
[0127]
[0128] Where λ 1 , Λ 2 , Λ 3 , Λ 4 And λ 5 Respectively indicate that the observed variable x is welcomed by customers x 1 , Pay attention to social welfare x 2 , Caring for Customers x 3 , High quality power supply x 4 And provide high-level services x 5 The effect of exogenous variable X.
[0129] A12. The method according to any one of A1-11, wherein the step of separately calculating the load coefficient in the external model and the regression coefficient in the internal model includes:
[0130] Estimate the latent variables through regression analysis to obtain the estimated value of each latent variable;
[0131] According to the estimated value of each latent variable, the value of the corresponding observation variable is regressed to respectively calculate the load coefficient of the external model and the regression coefficient of the internal model.
[0132] In the instructions provided here, a lot of specific details are explained. However, it can be understood that the embodiments of the present invention can be practiced without these specific details. In some instances, well-known methods, structures and technologies are not shown in detail, so as not to obscure the understanding of this specification.
[0133] Similarly, it should be understood that in order to simplify the present disclosure and help understand one or more of the various inventive aspects, in the above description of the exemplary embodiments of the present invention, the various features of the present invention are sometimes grouped together into a single embodiment, Figure, or its description. However, the disclosed method should not be interpreted as reflecting the intention that the claimed invention requires more features than those explicitly stated in each claim. More precisely, as reflected in the following claims, the inventive aspect lies in less than all the features of a single embodiment disclosed previously. Therefore, the claims following the specific embodiment are thus explicitly incorporated into the specific embodiment, wherein each claim itself serves as a separate embodiment of the present invention.
[0134] Those skilled in the art should understand that the modules or units or groups of the device in the example disclosed herein can be arranged in the device as described in this embodiment, or alternatively can be located in the same device as the example. In one or more different devices. The modules in the foregoing examples can be combined into one module or further divided into multiple sub-modules.
[0135] Those skilled in the art can understand that it is possible to adaptively change the modules in the device in the embodiment and set them in one or more devices different from the embodiment. The modules or units or groups in the embodiments can be combined into one module or unit or group, and in addition, they can be divided into multiple submodules or subunits or subgroups. Except that at least some of such features and/or processes or units are mutually exclusive, any combination can be used to compare all features disclosed in this specification (including the accompanying claims, abstract and drawings) and any method or methods disclosed in this manner or All the processes or units of the equipment are combined. Unless expressly stated otherwise, each feature disclosed in this specification (including the accompanying claims, abstract and drawings) may be replaced by an alternative feature providing the same, equivalent or similar purpose.
[0136] In addition, those skilled in the art can understand that although some embodiments described herein include certain features included in other embodiments but not other features, the combination of features of different embodiments means that they are within the scope of the present invention. Within and form different embodiments. For example, in the following claims, any one of the claimed embodiments can be used in any combination.
[0137] In addition, some of the embodiments are described herein as methods or combinations of method elements that can be implemented by a processor of a computer system or by other devices that perform the described functions. Therefore, a processor with the necessary instructions for implementing the method or method element forms a device for implementing the method or method element. In addition, the elements described herein of the device embodiment are examples of a device for implementing the function performed by the element for the purpose of implementing the invention.
[0138] The various technologies described here can be implemented in combination with hardware or software, or a combination of them. Therefore, the method and device of the present invention, or some aspects or parts of the method and device of the present invention may adopt program codes embedded in a tangible medium, such as a floppy disk, CD-ROM, hard drive, or any other machine-readable storage medium. (I.e., instructions) form in which when a program is loaded into a machine such as a computer and executed by the machine, the machine becomes a device for practicing the present invention.
[0139] When the program code is executed on a programmable computer, the computing device generally includes a processor, a storage medium readable by the processor (including volatile and nonvolatile memory and/or storage elements), and at least one input device, And at least one output device. The memory is configured to store program code; the processor is configured to execute the method for evaluating customer satisfaction of power supply enterprises based on the partial least square method of the present invention according to instructions in the program code stored in the memory.
[0140] By way of example and not limitation, computer-readable media includes computer storage media and communication media. Computer readable media include computer storage media and communication media. The computer storage medium stores information such as computer readable instructions, data structures, program modules, or other data. Communication media generally embody computer readable instructions, data structures, program modules or other data in modulated data signals such as carrier waves or other transmission mechanisms, and include any information delivery media. Combinations of any of the above are also included in the scope of computer-readable media.
[0141] As used herein, unless otherwise specified, the use of ordinal numbers "first", "second", "third", etc. to describe ordinary objects merely refers to different instances of similar objects, and is not intended to imply such The described objects must have a given order in terms of time, space, order, or in any other way.
[0142] Although the present invention has been described in terms of a limited number of embodiments, benefiting from the above description, those skilled in the art understand that other embodiments can be envisaged within the scope of the invention thus described. In addition, it should be noted that the language used in this specification is mainly selected for the purpose of readability and teaching, not for explaining or limiting the subject of the present invention. Therefore, without departing from the scope and spirit of the appended claims, many modifications and changes are obvious to those of ordinary skill in the art. For the scope of the present invention, the disclosure of the present invention is illustrative rather than restrictive, and the scope of the present invention is defined by the appended claims.

PUM

no PUM

Description & Claims & Application Information

We can also present the details of the Description, Claims and Application information to help users get a comprehensive understanding of the technical details of the patent, such as background art, summary of invention, brief description of drawings, description of embodiments, and other original content. On the other hand, users can also determine the specific scope of protection of the technology through the list of claims; as well as understand the changes in the life cycle of the technology with the presentation of the patent timeline. Login to view more.

Similar technology patents

Household suspension type water storage device convenient for rapid heating

InactiveCN111765629AGuaranteed practicalitySingle performance solution
Owner:杨煜海

Advertisement display board capable of being folded and stored

InactiveCN114724476ASave material and manpowerGuaranteed practicality
Owner:宿迁鹏诺环境科技有限公司

Intelligent dustbin switch control equipment

InactiveCN114348499AEnsure sanitationGuaranteed practicality
Owner:宿迁市金枫信息技术有限公司

Database auditing method, device, and system, equipment, and storage medium

PendingCN113608907AImprove safety and reliabilityGuaranteed practicality
Owner:ALIBABA (CHINA) CO LTD

Intelligent water spraying cleaning equipment for urban guardrail

InactiveCN114319199AReduce labor intensityGuaranteed practicality
Owner:宿迁市金枫信息技术有限公司

Classification and recommendation of technical efficacy words

  • Guaranteed practicality
  • High precision

Self-learning method and device for customer service robot

ActiveCN104699708AGuaranteed practicality
Owner:CHINA MOBILE GRP BEIJING

Restarting method and apparatus for mobile device

InactiveCN105975304AReduce chance of accidental restartGuaranteed practicality
Owner:QINGDAO HISENSE MOBILE COMM TECH CO LTD

Decoration scheme automatic obtaining method

PendingCN110263432AlogicalGuaranteed practicality
Owner:广州神蛋网络科技有限公司

Method, apparatus, terminal and computer storage medium with scoring consensus mechanism

InactiveCN109146682Ashorten confirmation timeGuaranteed practicality
Owner:CHINA UNITED NETWORK COMM GRP CO LTD

5G agricultural insect pest green prevention and control net tower pile

PendingCN113854258AGuaranteed practicalityImprove the efficiency of pest control
Owner:张居平

Method for forecasting short-term power in wind power station

InactiveCN102102626AHigh precision
Owner:NORTH CHINA ELECTRIC POWER UNIV (BAODING) +1

Numerical control machine tool wear monitoring method

InactiveCN102091972AHigh precisionReal-time monitoring of tool wear
Owner:HUAZHONG UNIV OF SCI & TECH +1

Advertisement recommendation method and apparatus

ActiveCN104965890AHigh precisionPrecise screening
Owner:SHENZHEN TENCENT COMP SYST CO LTD
Why Eureka
Try Eureka