Small sample data model verification method based on statistical analysis

A data model and verification method technology, applied in the direction of electrical digital data processing, special data processing applications, calculations, etc., can solve the problems that the distribution of regenerated samples deviates from the real distribution, and the accuracy of estimation results is low, so as to improve the accuracy and expand the scope Effect

Active Publication Date: 2018-11-06
HARBIN INST OF TECH
View PDF6 Cites 8 Cited by
  • Summary
  • Abstract
  • Description
  • Claims
  • Application Information

AI Technical Summary

Problems solved by technology

[0004] The purpose of the present invention is to solve the problem that the scope of the traditional Bootstrap method regenerated samples is limited to the original sample range; especially in the case of a small sample size, it may cause the

Method used


Image

  • Small sample data model verification method based on statistical analysis
  • Small sample data model verification method based on statistical analysis
  • Small sample data model verification method based on statistical analysis

Examples


specific Embodiment approach 1

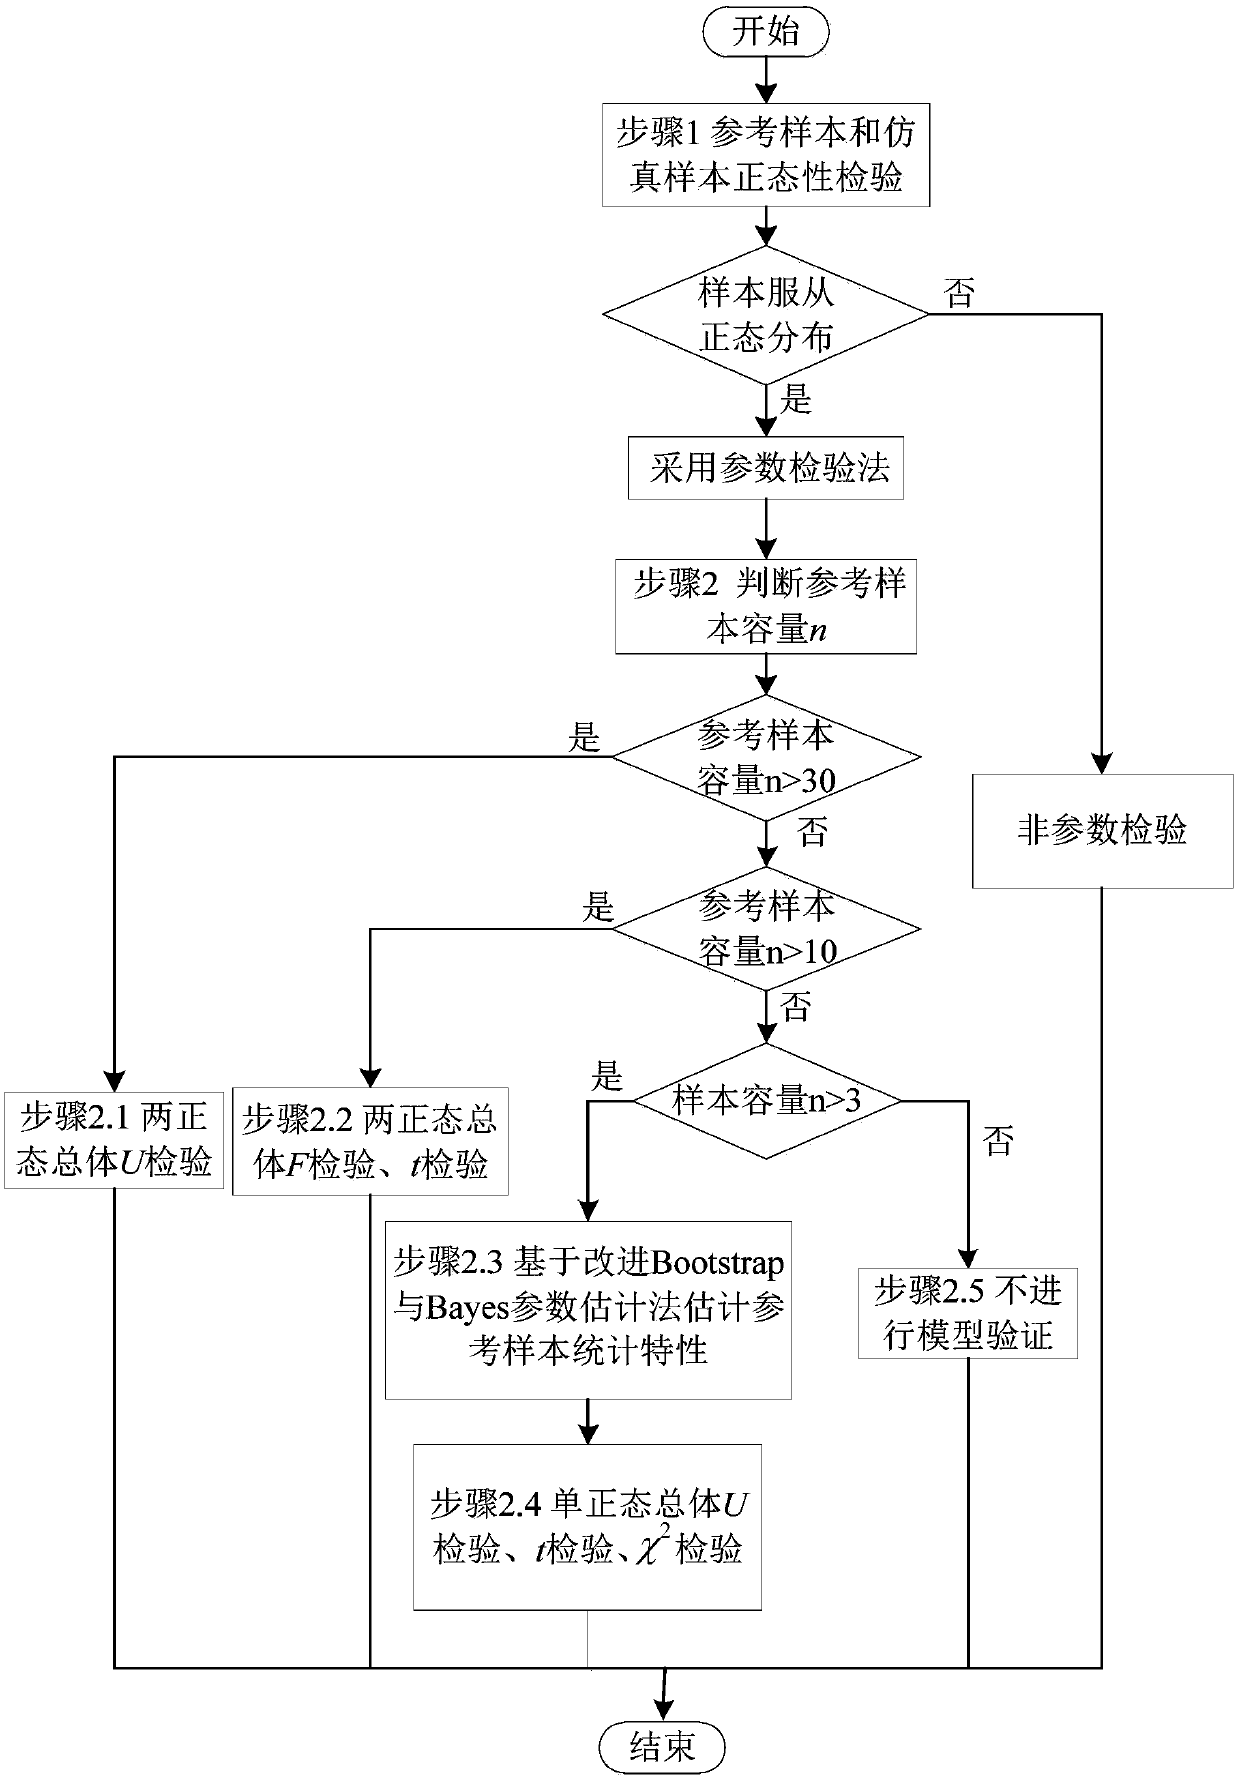
[0023] Specific implementation mode 1: The specific process of a sample data model verification method based on statistical analysis in this implementation mode is as follows:

[0024] Step 1. Perform normality test on the reference sample and the simulation sample. If the reference sample and the simulation sample obey the normal distribution, then perform step 2. Otherwise, use the non-parametric test method to analyze the similarity of the cumulative probability distribution of the reference sample and the simulation sample. degree;

[0025] The reference sample is experimental data of a real physical system, such as experimental data obtained by an aircraft system;

[0026] The simulation sample is the experimental data obtained by the simulation model corresponding to the real physical system, such as the experimental data of the aircraft simulation model;

[0027] Described non-parametric test method comprises K-S test, signed rank test, runs test;

[0028] Step 2. Det...

specific Embodiment approach 2

[0035] Specific embodiment 2: The difference between this embodiment and specific embodiment 1 is that in the step 1, the normality test is carried out on the reference sample and the simulated sample, and the specific process is as follows:

[0036] The normality test adopts the W test method, and the W test method selects the index quantity as:

[0037]

[0038] Wherein, n is the sample size, when n is an even number, k=n / 2; when n is an odd number, k=(n-1) / 2;

[0039] x (1) ≤X (2) ≤...X (n) Sort samples in ascending order;

[0040] a k is the calculation coefficient (obtainable by looking up the table);

[0041] The rejection domain of the W test method is W≤W a ,

[0042] W a is the α quantile (obtainable by looking up the table), and α is the significance level;

[0043] Here is an example of a normality test:

[0044] For example, there are 10 sets of data: 2.7, -1.2, -1.0, 0, 0.7, 2.0, 3.7, -0.6, 0.8, -0.3, use the W test method to test whether the set of d...

specific Embodiment approach 3

[0050] Specific embodiment three: the difference between this embodiment and specific embodiment one or two is that: in the step 2.1, when the reference sample size n≥30, the U test method of the two normal population means is used to compare the reference sample and the simulation sample. Consistency is analyzed to obtain whether the mean values ​​of the reference sample and the simulated sample are consistent; the specific process is:

[0051] Let the reference sample X=(X 1 ,...,X n ) obey the normal distribution N(μ 1 ,σ 1 2 ), simulation sample Y=(Y 1 ,...,Y m ) obey the normal population N(μ 2 ,σ 2 2 );

[0052] (X 1 ,...,X n ) is the experimental data of n real physical systems, that is, the reference sample; (Y 1 ,...,Y m ) is the experimental data output by the simulation model for m times, that is, the simulation sample; n is the reference sample size, m is the simulation sample size; m and n are both positive integers; μ 1 is the mean value of the expe...


PUM


Abstract

The invention discloses a small sample data model verification method based on statistical analysis, relating to a small sample data model verification method. The invention aims to solve the problemsthat the scope of a conventional Bootstrap method for reproducing samples is limited to an original sample range, especially in the case of a small sample size, the distribution of the reproduced samples may deviate from the real distribution, the estimation results may be inaccurate, and certain risks exist. The method includes the following processes: step I, performing a normality test on a reference sample and a simulation sample, and if obeying the normal distribution, performing step II; and step II, when n is greater than or equal to 30, adopting a U test method; when n is greater than10 and less than 30, adopting a t or F test method; when n is greater than 3 and less than or equal to 10, adopting a formula 1 and a formula 2 (as shown in the original specification) to separatelyperform a single normal population parameter test on the simulation sample in the step I; determining whether the obtained mean value and variance of the reference sample and the simulation sample areconsistent; and when n is less than 3, not performing model verification. The scheme of the invention is applied to the field of simulation model verification.

Description

technical field [0001] The invention relates to a small sample data model verification method. Background technique [0002] Model verification is an important means to ensure that the simulation model can correctly replace the real system for experiments, and it is one of the key issues in the field of simulation research. The main idea of ​​model verification is to analyze the consistency of the reference data output by the real physical system experiment and the simulation data output by the simulation model experiment under the same input conditions; determine whether the simulation model is credible according to whether the simulation sample is consistent with the reference sample . In practical application engineering, such as aircraft simulation models, due to the limitations of test conditions, test funds and other factors, it is impossible to carry out a large number of repetitive tests, making the sample size of data output by the real system small. In the applic...

Claims


Application Information

Patent Timeline
IPC IPC(8): G06F17/50
CPCG06F30/20Y02T90/00
Inventor 马萍周玉臣宋婷方可杨明
Owner HARBIN INST OF TECH
Why Eureka
Try Eureka