
An upstream and downstream water level prediction method for cascade power stations

A cascade power station and prediction method technology, applied in the direction of prediction, data processing applications, instruments, etc., can solve the problems of reducing learning efficiency, increasing the difficulty of model training, and affecting lower-level power stations, so as to improve prediction accuracy, improve water level prediction ability, The effect of solid theoretical support

Active Publication Date: 2021-10-15
CHINA YANGTZE POWER
View PDF2 Cites 0 Cited by
  • Summary
  • Abstract
  • Description
  • Claims
  • Application Information

AI Technical Summary

Problems solved by technology

However, in terms of water level prediction of cascade power stations, especially the water level of downstream power stations, due to the close connection between cascade power stations, the operation of upstream power stations will affect the water level of lower power stations, and there is a time lag in the impact due to water flow propagation, while Common feed-forward neural networks such as BP neural network or RBF neural network are difficult to capture this feature
Moreover, if the water level and output data at several previous moments are used as input samples by window processing, there will be too many nodes in the input layer. If it is further necessary to continuously predict the upstream and downstream water levels at multiple moments, the number of nodes in the input layer will increase accordingly , leading to too many model training parameters, which will undoubtedly increase the difficulty of model training and reduce learning efficiency

Method used


Image

  • An upstream and downstream water level prediction method for cascade power stations
  • An upstream and downstream water level prediction method for cascade power stations
  • An upstream and downstream water level prediction method for cascade power stations

Examples


Embodiment 1

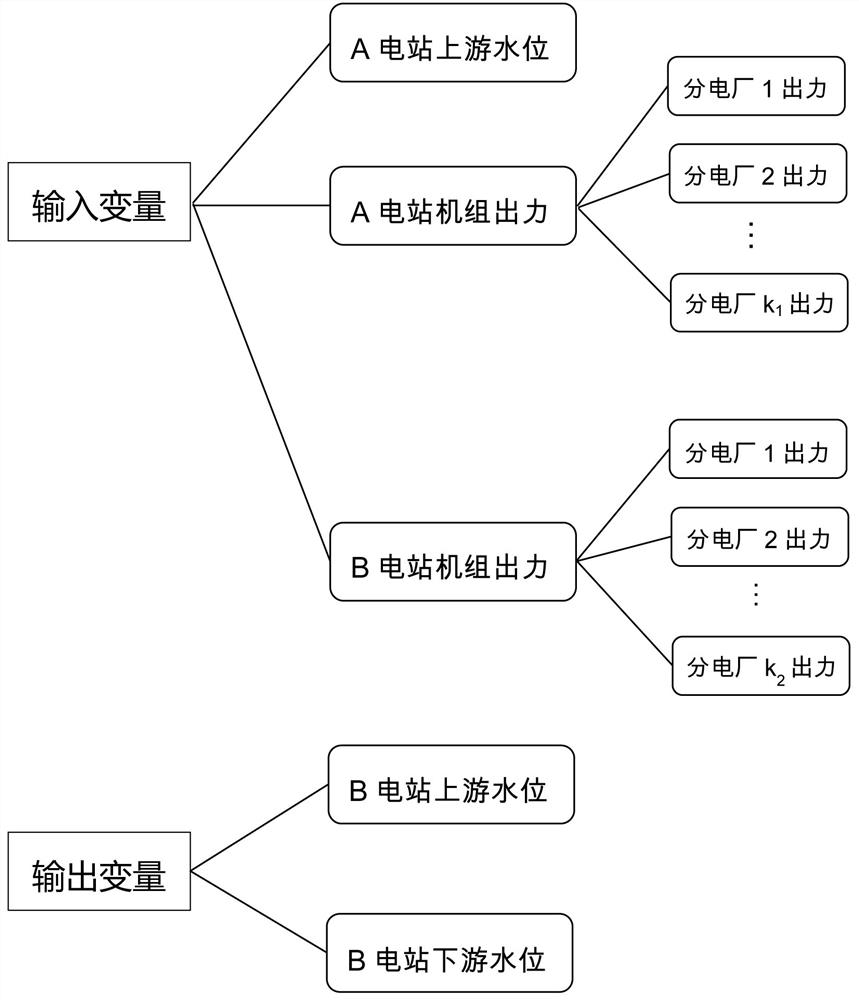
[0082] Step 1, select input variables and output variables. The input variables are the output of each sub-power plant of the upstream power station and the downstream power station, and the upstream water level of the upstream power station. Since the flow data of the power station are all estimated and contain certain deviations, the flow data are not considered, but the implicit changes in flow are reflected indirectly through real-time monitoring data such as water level and active power. The output variable is the upstream and downstream water levels of the downstream power station. see details figure 1 .

[0083] Step 2, standardize the data to eliminate the influence of dimension. Using the min-max standardization method, the original value in step 1 is mapped to the [-1, 1] interval, and the conversion function is as follows:

[0084]

[0085] Among them, x is the original data, x' is the standardized data, min is the minimum value of the sample, and max is the ...

Embodiment 2

[0132] Take the cascade hydropower station composed of A power station and B power station as an example, where A power station represents the upstream hydropower station, and B power station represents the downstream hydropower station. The dimension of the input vector is 8 dimensions, the dimension of the output vector is 2 dimensions, the number of LSTM layers is 1, the number of LSTM layer units is 20, and the time step is 60. The algorithm designed by the present invention is used for training, and the water level prediction error histogram of the upstream water level of B power station is obtained for 6 consecutive hours. Figure 5 , the water level prediction error histogram of downstream water level of B power station for 6 consecutive hours is shown in Image 6 , the water level prediction error results of the upstream water level of the B reservoir for 6 consecutive hours are shown in Table 2, and the water level prediction error results of the downstream water leve...


PUM


Abstract

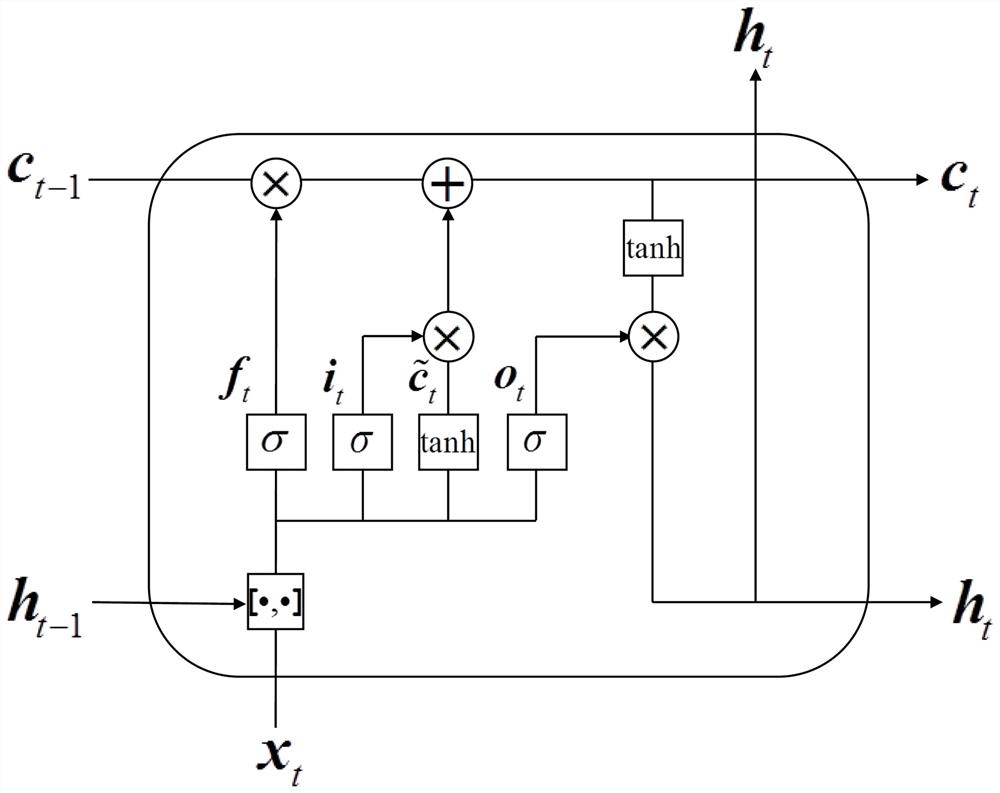
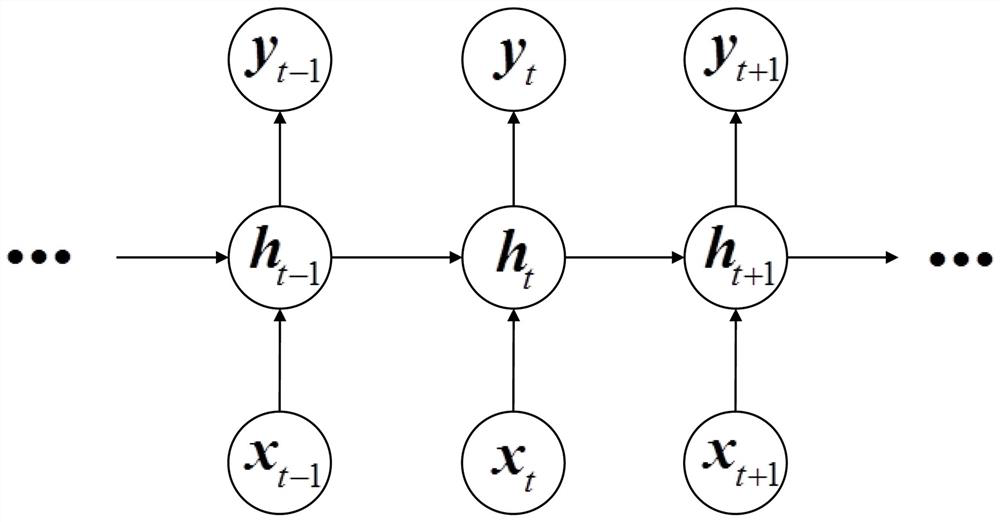
The invention discloses a method for predicting upstream and downstream water levels of a cascade power station, which includes the following steps: Step 1, selecting input variables and output variables; Step 2, standardizing the data to eliminate the influence of dimensions; Step 3, determining the input Vector dimension, LSTM layer number, output vector dimension, and time step; step 4, LSTM forward propagation process and error back propagation process; forward propagation process is input into LSTM network in sequence according to time step, and corresponding output value is obtained ; Using the sum of the squares of the error between the output value and the true value as the loss function, the error is backpropagated along time to update the parameters; step 5, use the trained model for multi-moment continuous prediction. Applying LSTM to the water level prediction of cascade power stations can capture the lagging influence information of upstream power stations on downstream power stations, improve prediction accuracy, and provide more reliable theoretical support for scientific scheduling decisions.

Description

technical field [0001] The invention relates to a method for predicting upstream and downstream water levels of a cascade power station, and belongs to the technical field of water level prediction. Background technique [0002] Water level prediction refers to predicting the upstream or downstream water level of a hydropower station a certain time in advance. Accurate water level prediction is of great significance to hydropower station scheduling. However, hydropower stations are affected by many factors during their operation, resulting in large deviations in the prediction of water level changes in hydropower stations, which in turn affects the implementation effect of the dispatching plan. Especially for cascade hydropower stations with close hydraulic connections, the water level rises and falls with hysteresis, and the stable water levels after flooding, flat water, and receding water are also different, making it more difficult to accurately predict the water level o...

Claims


Application Information

Patent Timeline
Patent Type & Authority Patents(China)
IPC IPC(8): G06Q10/04G06Q50/06G06N3/04
CPCG06N3/049G06Q10/04G06Q50/06
Inventor 刘亚新樊启萌华小军刘志武徐杨杨旭张玉柱
Owner CHINA YANGTZE POWER
Learn More