Data display method and device, computer-readable storage medium and electronic equipment

A data display and data technology, applied in the field of data visualization technology and big data, can solve problems affecting user experience

Active Publication Date: 2018-11-13
NEUSOFT CORP
View PDF9 Cites 5 Cited by
  • Summary
  • Abstract
  • Description
  • Claims
  • Application Information

AI Technical Summary

Problems solved by technology

However, when displaying many images, manual adjustment will bring a lot of extra workload to the user and affect the user experience

Method used


Image

  • Data display method and device, computer-readable storage medium and electronic equipment
  • Data display method and device, computer-readable storage medium and electronic equipment
  • Data display method and device, computer-readable storage medium and electronic equipment

Examples


Embodiment Construction

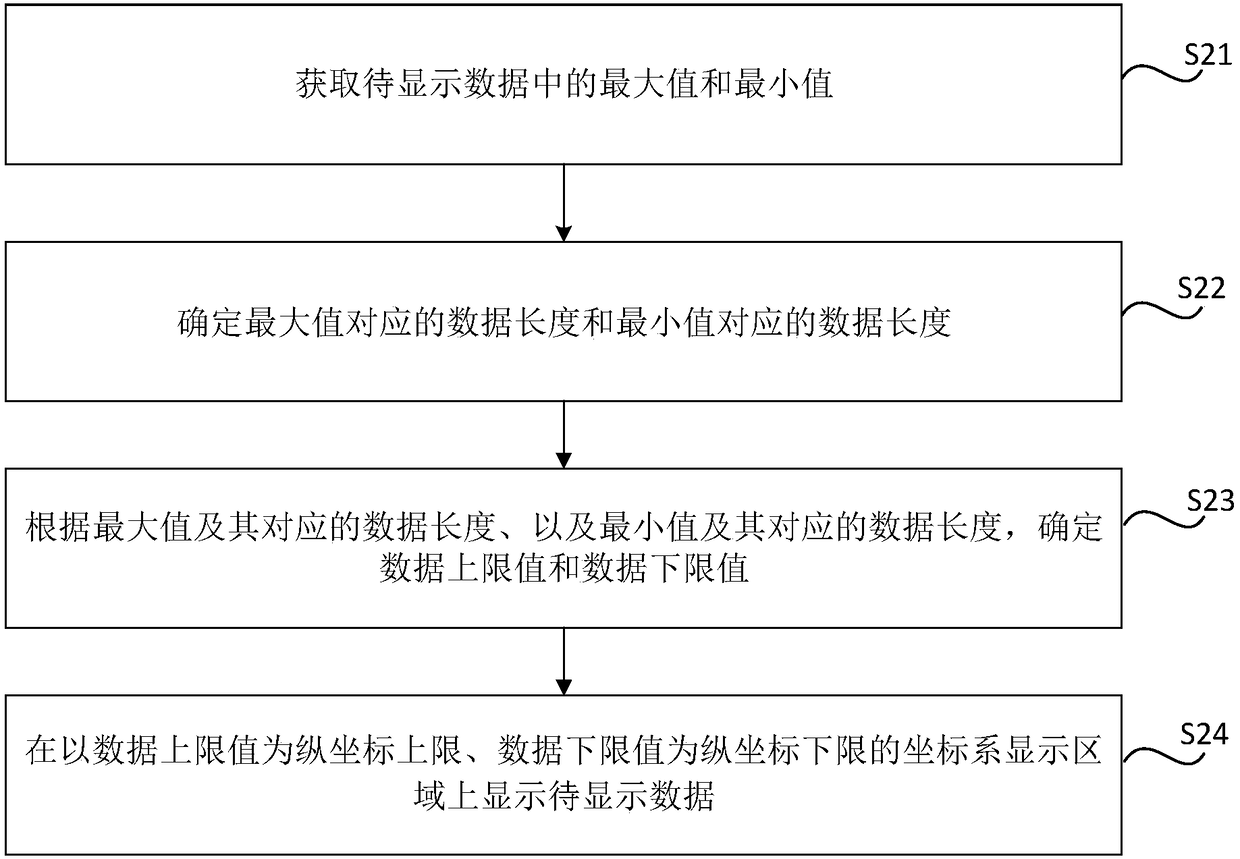
[0035] Specific embodiments of the present disclosure will be described in detail below in conjunction with the accompanying drawings. It should be understood that the specific embodiments described here are only used to illustrate and explain the present disclosure, and are not intended to limit the present disclosure.

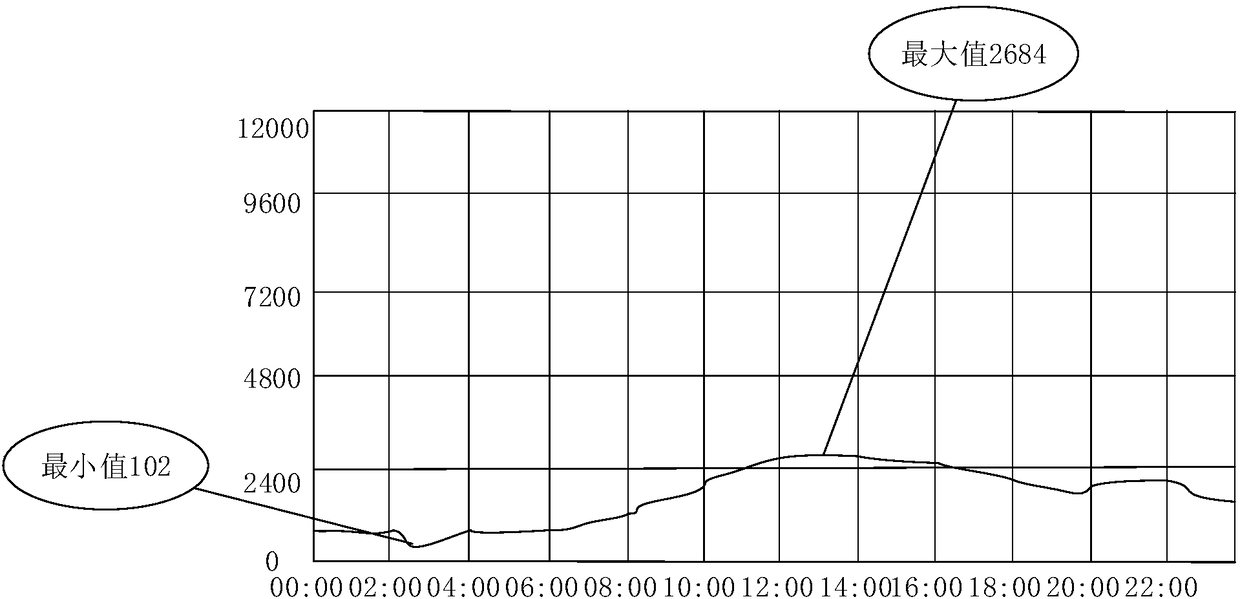
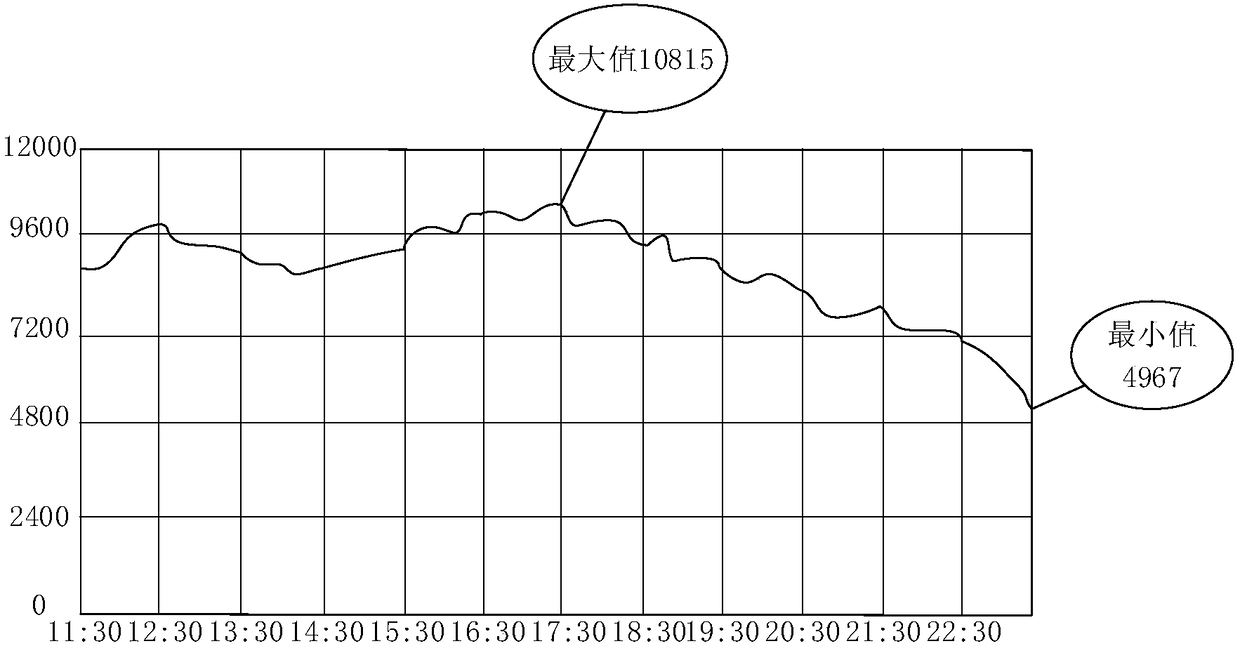
[0036] With the popularization of big data technology, data visualization has gradually become a hot spot in the field of big data. For example, in a system for displaying passenger flow, when displaying the passenger flow data of each station of a certain line, the maximum and minimum values ​​of passenger flow are presented due to the time, the importance of each station in the transportation system, etc. Make a big difference. For example, if Figure 1A and Figure 1B As shown, the maximum passenger flow of station D from 0:00 to 22:00 is 2684 passengers, and the minimum passenger flow is 102 person-times; the maximum passenger flow of station E from 11:...


PUM


Abstract

The invention relates to a data display method, a data display device, a computer-readable storage medium and electronic equipment. The method comprises the steps of acquiring a maximum value and a minimum value in to-be-displayed data; determining data lengths corresponding to the maximum value and the minimum value; determining a data upper limit value and a data lower limit value according to the maximum value and the corresponding data length thereof, the minimum value and the corresponding data length thereof; and displaying the to-be-displayed data in a display region of a coordinate system by using the data upper limit value as an upper limit of a vertical coordinate and the data lower limit value as a lower limit of the vertical coordinate. Through the abovementioned technical scheme, for different to-be-displayed data, display ranges of coordinate axes in the coordinate system can be self-adaptively and dynamically adjusted, so that the to-be-displayed data are uniformly distributed in the display region of the coordinate system, therefore, a variation trend of the to-be-displayed data can be displayed more clearly.

Description

technical field [0001] The present disclosure relates to the field of data visualization technology and big data, and in particular, to a data display method, device, computer-readable storage medium, and electronic equipment. Background technique [0002] With the popularization of big data technology, data visualization has gradually become a hot spot in the field of big data. In the field of big data, phenomena such as uneven data distribution and local data over-density put forward higher requirements for data visualization technology. [0003] However, in the prior art, when the display data is concentrated in a partial area of ​​the display area, the user is required to manually adjust the boundary value of the vertical axis of the display area to achieve uniform presentation of the display data. However, when displaying many pictures, manual adjustment will bring a lot of extra workload to the user and affect the user experience. Contents of the invention [0004]...

Claims


Application Information

Patent Timeline
Patent Type & Authority Applications(China)
IPC IPC(8): G06F17/30G06T11/20
CPCG06T11/206
Inventor 白爽齐玉涛高洋
Owner NEUSOFT CORP
Why Eureka
Try Eureka