
Method for drawing Bode plot, and oscilloscope

An oscilloscope and a technology for displaying coordinates, applied to digital variable/waveform display, instruments, measuring devices, etc., can solve the problems of cumbersome process and low efficiency, and achieve the effect of avoiding cumbersomeness and improving drawing efficiency

Inactive Publication Date: 2018-12-18
SHENZHEN CITY SIGLENT TECH
View PDF5 Cites 3 Cited by
  • Summary
  • Abstract
  • Description
  • Claims
  • Application Information

AI Technical Summary

Problems solved by technology

This process requires the user to continuously manually control the signal source and oscilloscope, and obtain data points to draw the Bode plot, which is cumbersome and inefficient

Method used


Image

  • Method for drawing Bode plot, and oscilloscope
  • Method for drawing Bode plot, and oscilloscope
  • Method for drawing Bode plot, and oscilloscope

Examples


Embodiment Construction

[0031] The present invention will be further described in detail below through specific embodiments in conjunction with the accompanying drawings. The characteristics, operations or characteristics described in the specification can be combined in any appropriate manner to form various embodiments.

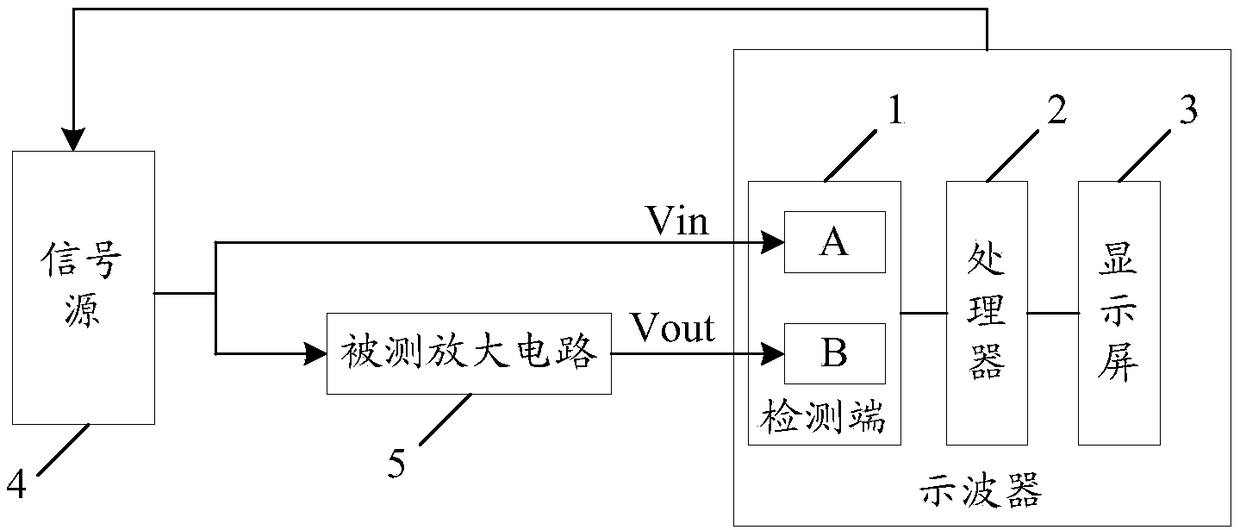
[0032] In the embodiment of the present invention, the oscilloscope automatically controls the frequency of the signal source according to the signal source configuration parameters set by the user, automatically controls the time base and voltage gear according to the output signal of the amplified circuit under test, and calculates the coordinates of the amplitude-frequency point and the phase-frequency point Coordinates, and then draw a Bode plot.

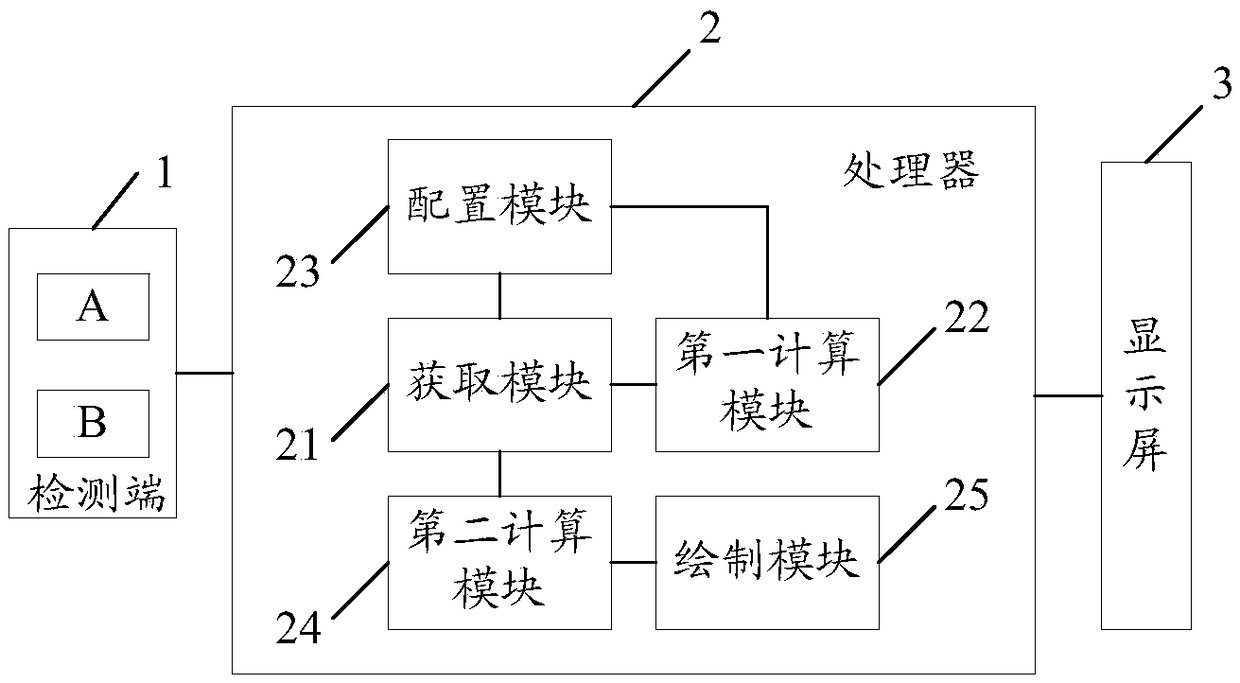
[0033] Please refer to figure 1 , figure 1 A schematic structural diagram of an oscilloscope provided for an embodiment of the present invention, such as figure 1 As shown, the oscilloscope includes a detection terminal 1, a proc...


PUM


Abstract

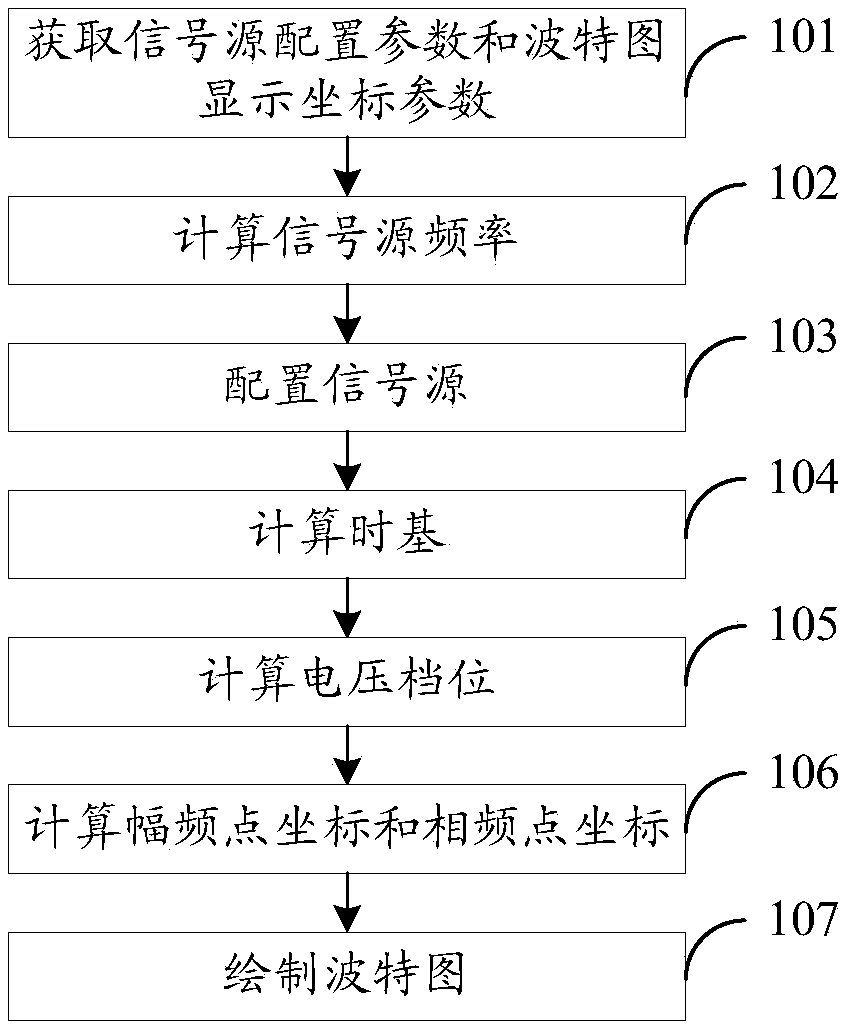
The invention discloses a method for drawing a Bode plot, and an oscilloscope. The method comprises the following steps that: obtaining a signal source configuration parameter and a Bode plot displaycoordinate parameter set on the oscilloscope; according to the signal source configuration parameter, calculating signal source frequency; configuring the signal source configuration parameter and thesignal source frequency to a signal source to enable the signal source to generate a detection signal used for detecting a detected amplification circuit; according to the output signal of the detected amplification circuit, calculating the time base and the voltage range of the oscilloscope; according to the obtained amplitude and offset phase of the output signal of the detected amplification circuit as well as a Bode plot display coordinate parameter, calculating an amplitude-frequency point coordinate and a phase frequency point coordinate; and independently according to the amplitude-frequency point coordinate and the phase frequency point coordinate, drawing the Bode plot. Since the oscilloscope can automatically control the signal source and automatically draw the Bode plot according to a small quantity of parameters set by the user, the Bode plot drawing function of the Bode plot is realized, so that tedious work for manually drawing the Bode plot is effectively avoided, and efficiency is improved.

Description

technical field [0001] The invention relates to the technical field of electronic measurement, in particular to a method for drawing Bode diagrams and an oscilloscope. Background technique [0002] For an electronic device or an electronic circuit, the electronic signal generated by it is generally a complex signal composed of signals of multiple frequency components, rather than a simple single frequency signal. The amplifying circuit is one of the most widely used electronic circuits, and it is also the basic unit circuit that constitutes other electronic circuits. In the amplifying circuit, due to the existence of reactance components, the amplitude magnification of different frequency signals is different, which will cause signal amplitude. At the same time, the phase shift of the amplifier circuit for different frequency signals is also different, which will also cause phase distortion. Therefore, it is necessary to analyze the amplitude distortion and phase shift dist...

Claims


Application Information

Patent Timeline
IPC IPC(8): G01R13/00
CPCG01R13/00
Inventor 唐尧江陈锋江新志
Owner SHENZHEN CITY SIGLENT TECH
Learn More