

Cluster analysis method and system for consumer power consumption behavior based on regulating potential index
A cluster analysis and user technology, applied in data processing applications, character and pattern recognition, instruments, etc., can solve the problems of no proposed clustering method, user adjustment potential analysis, etc., to improve clustering efficiency and ensure clustering. Effect, good effect of polymerization
Inactive Publication Date: 2019-01-04
STATE GRID CORP OF CHINA +3
View PDF4 Cites 13 Cited by
- Summary
- Abstract
- Description
- Claims
- Application Information
AI Technical Summary
Problems solved by technology
For example, some studies propose a user clustering index system that considers market value, potential market value, and regional contribution value; or use fuzzy C-means clustering and pattern recognition principles to propose a user-owned electricity industry based on daily load curves. Classification and synthesis methods, or clustering based on the cosine similarity of typical load patterns. These studies mostly proposed corresponding load clustering indicators, but did not analyze the adjustment potential of users
There are also studies that use the feature optimization strategy to extract the best feature set of the load curve to perform cluster analysis on the user's electricity consumption data, and propose a cluster number optimization strategy, but do not propose a corresponding clustering method
In addition, although the existing studies have all carried out research on the cluster analysis of load data, they have not proposed a reasonable and effective clustering method for the characteristics of user adjustment potential in the context of continuous access to flexible loads.
Method used
View moreImage
Smart ImageViewing Examples

Examples
Embodiment 1
[0115] Such as Figure 4 ~ Figure 7 As shown, in this embodiment, the cluster analysis is performed on the load data of a small number of users and a large number of users at the same time, and the clustering results of each user are obtained. Figure 4 and Figure 5 Reflects the effect of cluster analysis on a small number of users, Figure 6 and Figure 7 It reflects the cluster analysis effect of the method proposed in the present invention on a large number of users. It can be seen from the results that the clustering method provided by the present invention has a better effect on user cluster analysis.
Login to View More PUM
 Abstract
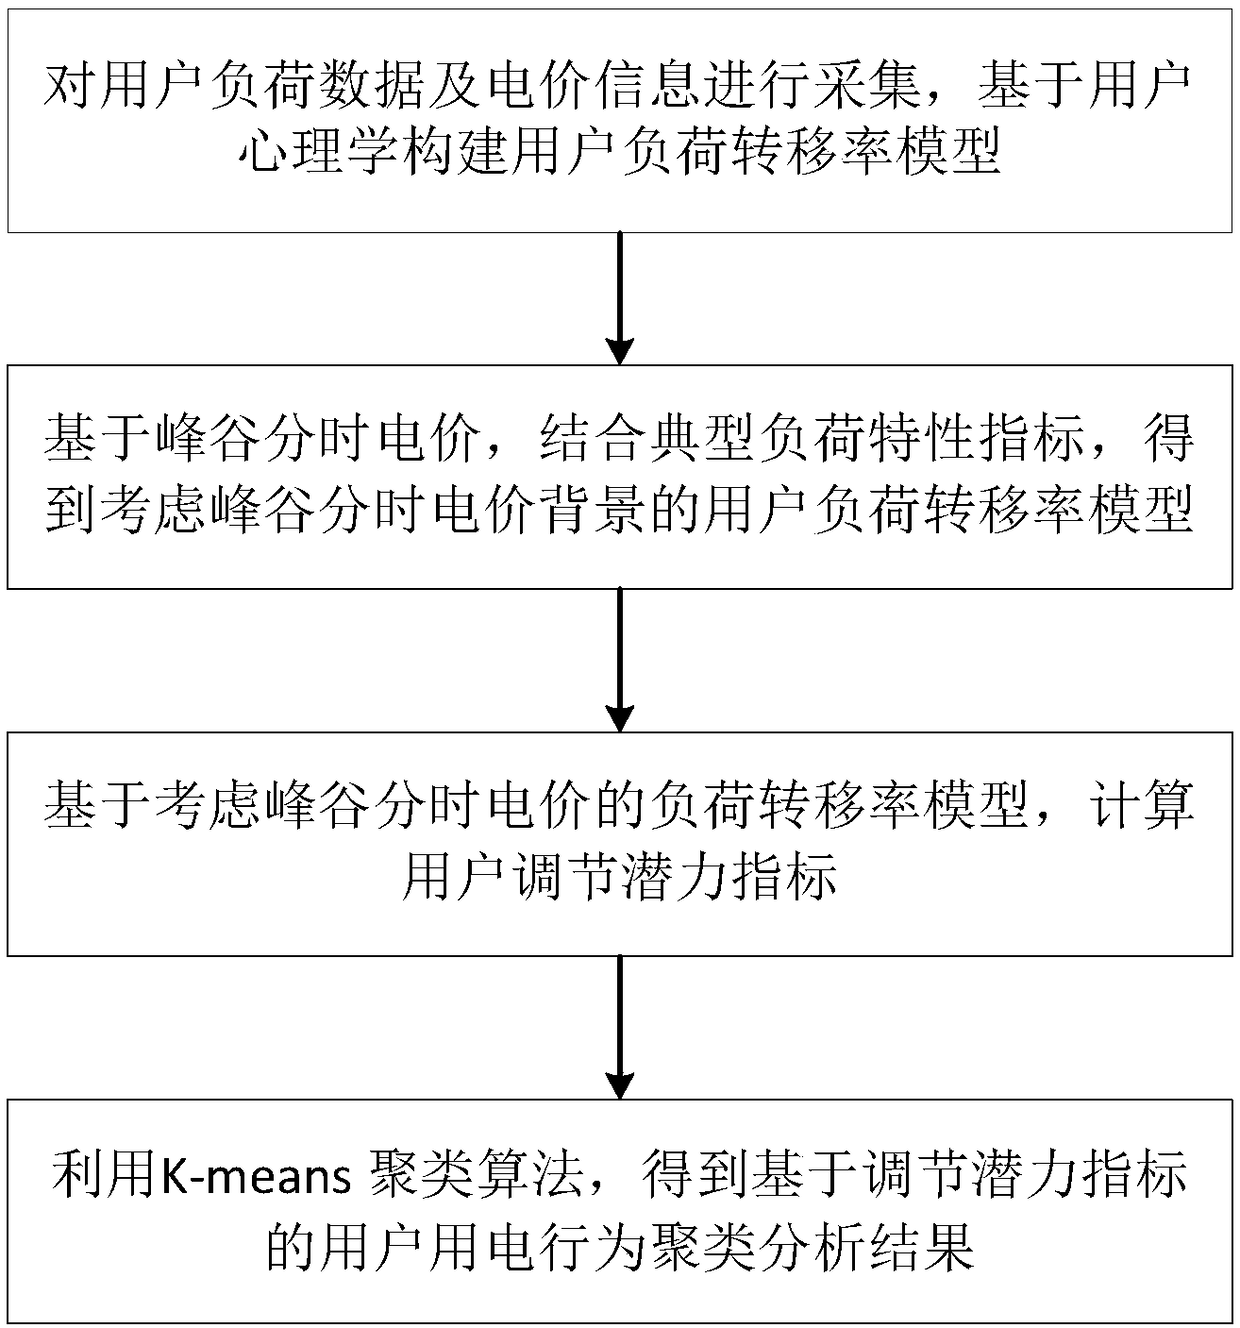
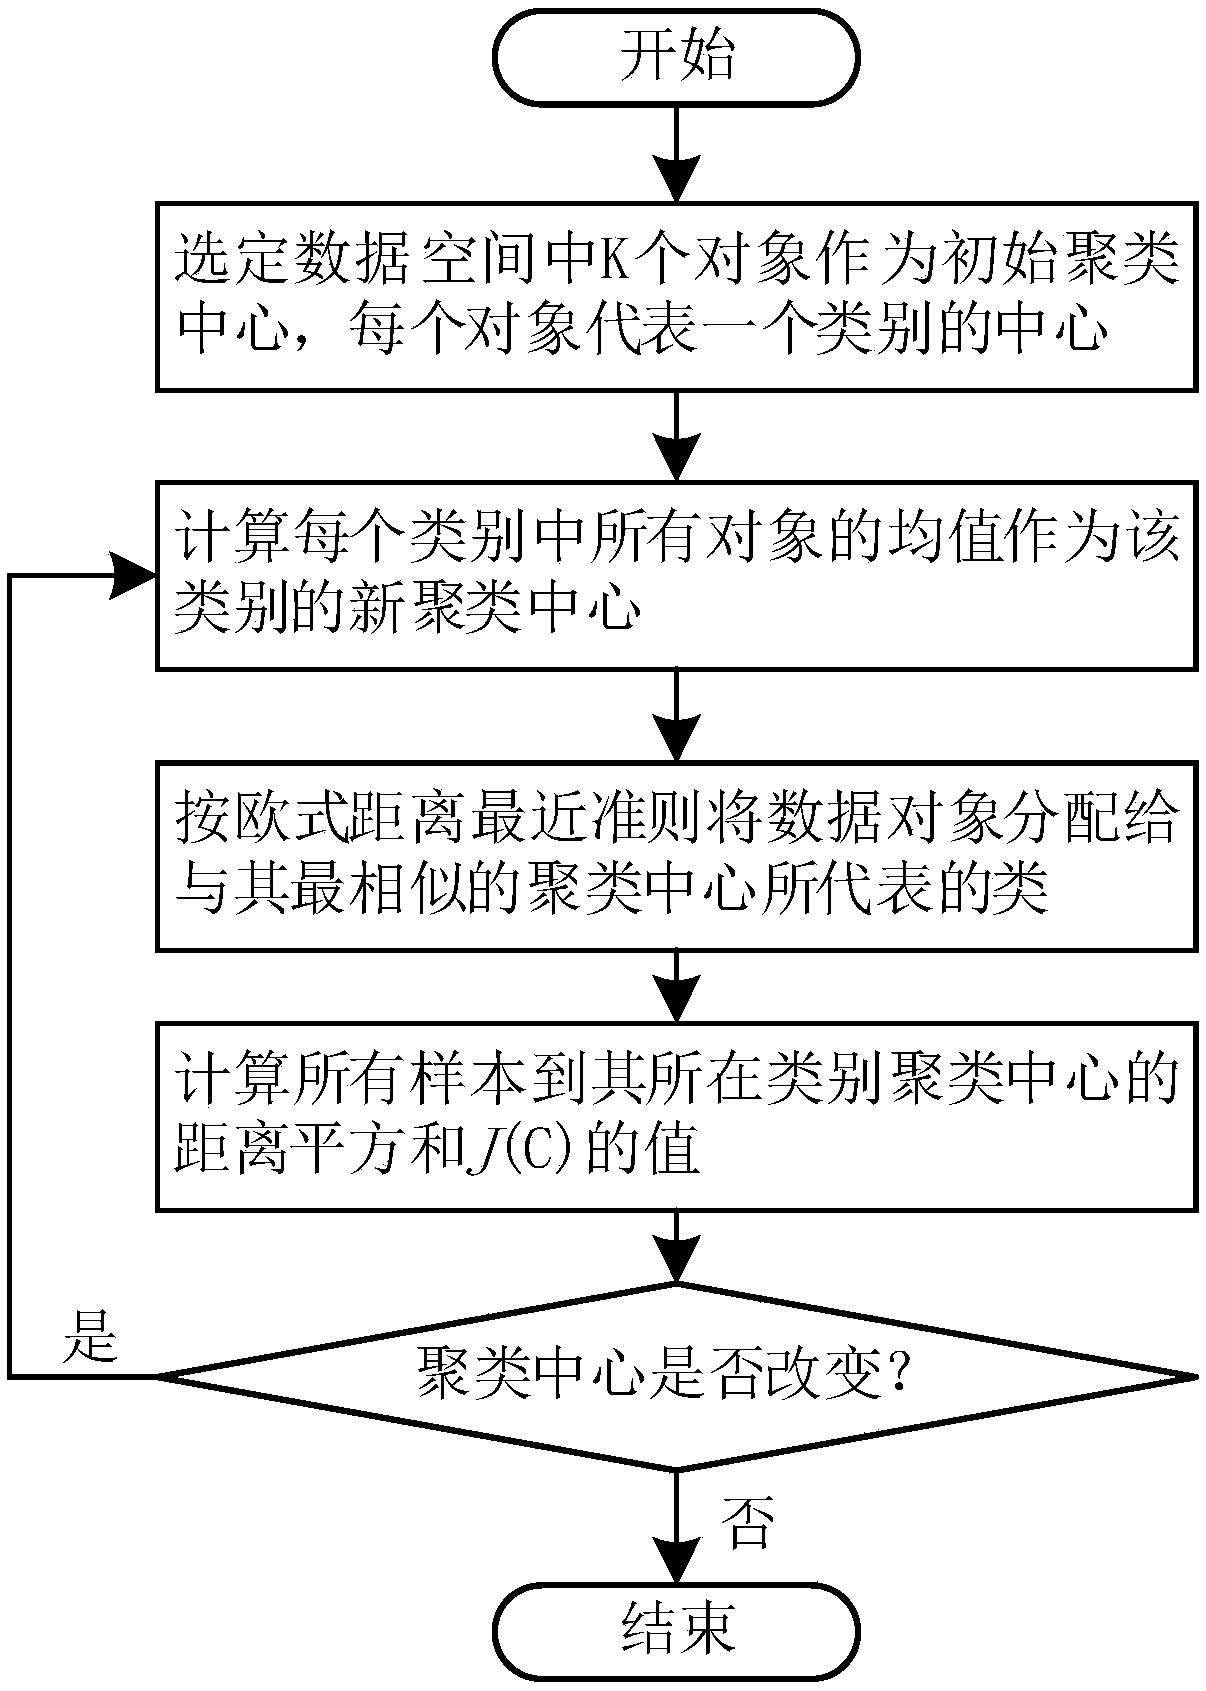
The invention relates to a method and a system for clustering analysis of user power consumption behavior based on an adjustment potential index, characterized by comprising the following steps of: 1)constructing a user load transfer rate model considering the peak-valley time-of-use price according to the user daily load curve information and the peak-valley time-of-use price information obtained in advance, and calculating a user regulation potential index; 2) taking the user regulation potential index as a sample space set, combining with K. Means clustering algorithm, getting the consumerbehavior clustering results based on the adjustment potential index. The invention has good aggregation effect when clustering analysis is carried out on users with obvious peak-valley characteristics, and can ensure clustering effect while improving clustering efficiency when clustering analysis is carried out on large-scale users, and can be widely used in the field of power system data analysis of peak-valley time-of-use electricity price.
Description
technical field [0001] The invention relates to the field of smart grid technology and power system data analysis, in particular to a method and system for cluster analysis of user electricity consumption behavior based on adjustment potential indicators. Background technique [0002] The unbalanced state of electricity supply and demand during the peak and valley periods of electricity consumption is still a very serious problem at present. With the advancement of smart grid construction, a large number of smart measurement terminals have been put into use in recent years, which enables real-time collection of user electricity consumption data and reflects more user electricity consumption patterns. This is to understand the user's electricity consumption characteristics and improve load forecasting. Accuracy, identification of user electricity consumption patterns, assessment of demand response potential, and guidance for electricity pricing provide the basis. As a widely...
Claims
Login to View More Application Information
Patent Timeline
 Patent Type & AuthorityApplications(China)
IPC IPC(8): G06Q10/06G06Q50/06G06K9/62
CPCG06Q10/06315G06Q50/06G06F18/23213Y02P90/82
Inventor杨卫红吴志力王旭阳刘艳茹王云飞王丹兰宇胡庆娥姜世公
OwnerSTATE GRID CORP OF CHINA