
Method for checking correlation degree of carbon emission data of gas unit based on product difference analysis

A technology of data association and inspection method, applied in measurement devices, instruments, etc., can solve the problems of inability to meet the requirements of accurate verification and timely reporting of carbon emissions, and achieve the effect of improving real validity, simple calculation logic, and ensuring reliability

Active Publication Date: 2019-03-08
JIANGSU FRONTIER ELECTRIC TECH +3
View PDF5 Cites 8 Cited by
  • Summary
  • Abstract
  • Description
  • Claims
  • Application Information

AI Technical Summary

Problems solved by technology

Under the situation that my country took the lead in starting the construction of the national carbon market with the power industry as a breakthrough, the existing carbon emission accounting method based on emission factors can no longer meet the requirements for accurate verification and timely reporting of carbon emissions, and continuous monitoring of carbon dioxide emissions should be used The system conducts accurate real-time carbon emission monitoring of thermal power units, and uses the actual measurement method to calculate carbon dioxide emissions online based on on-site monitoring data, improving the timeliness and accuracy of carbon emission accounting data

Method used


Image

  • Method for checking correlation degree of carbon emission data of gas unit based on product difference analysis
  • Method for checking correlation degree of carbon emission data of gas unit based on product difference analysis
  • Method for checking correlation degree of carbon emission data of gas unit based on product difference analysis

Examples


Embodiment Construction

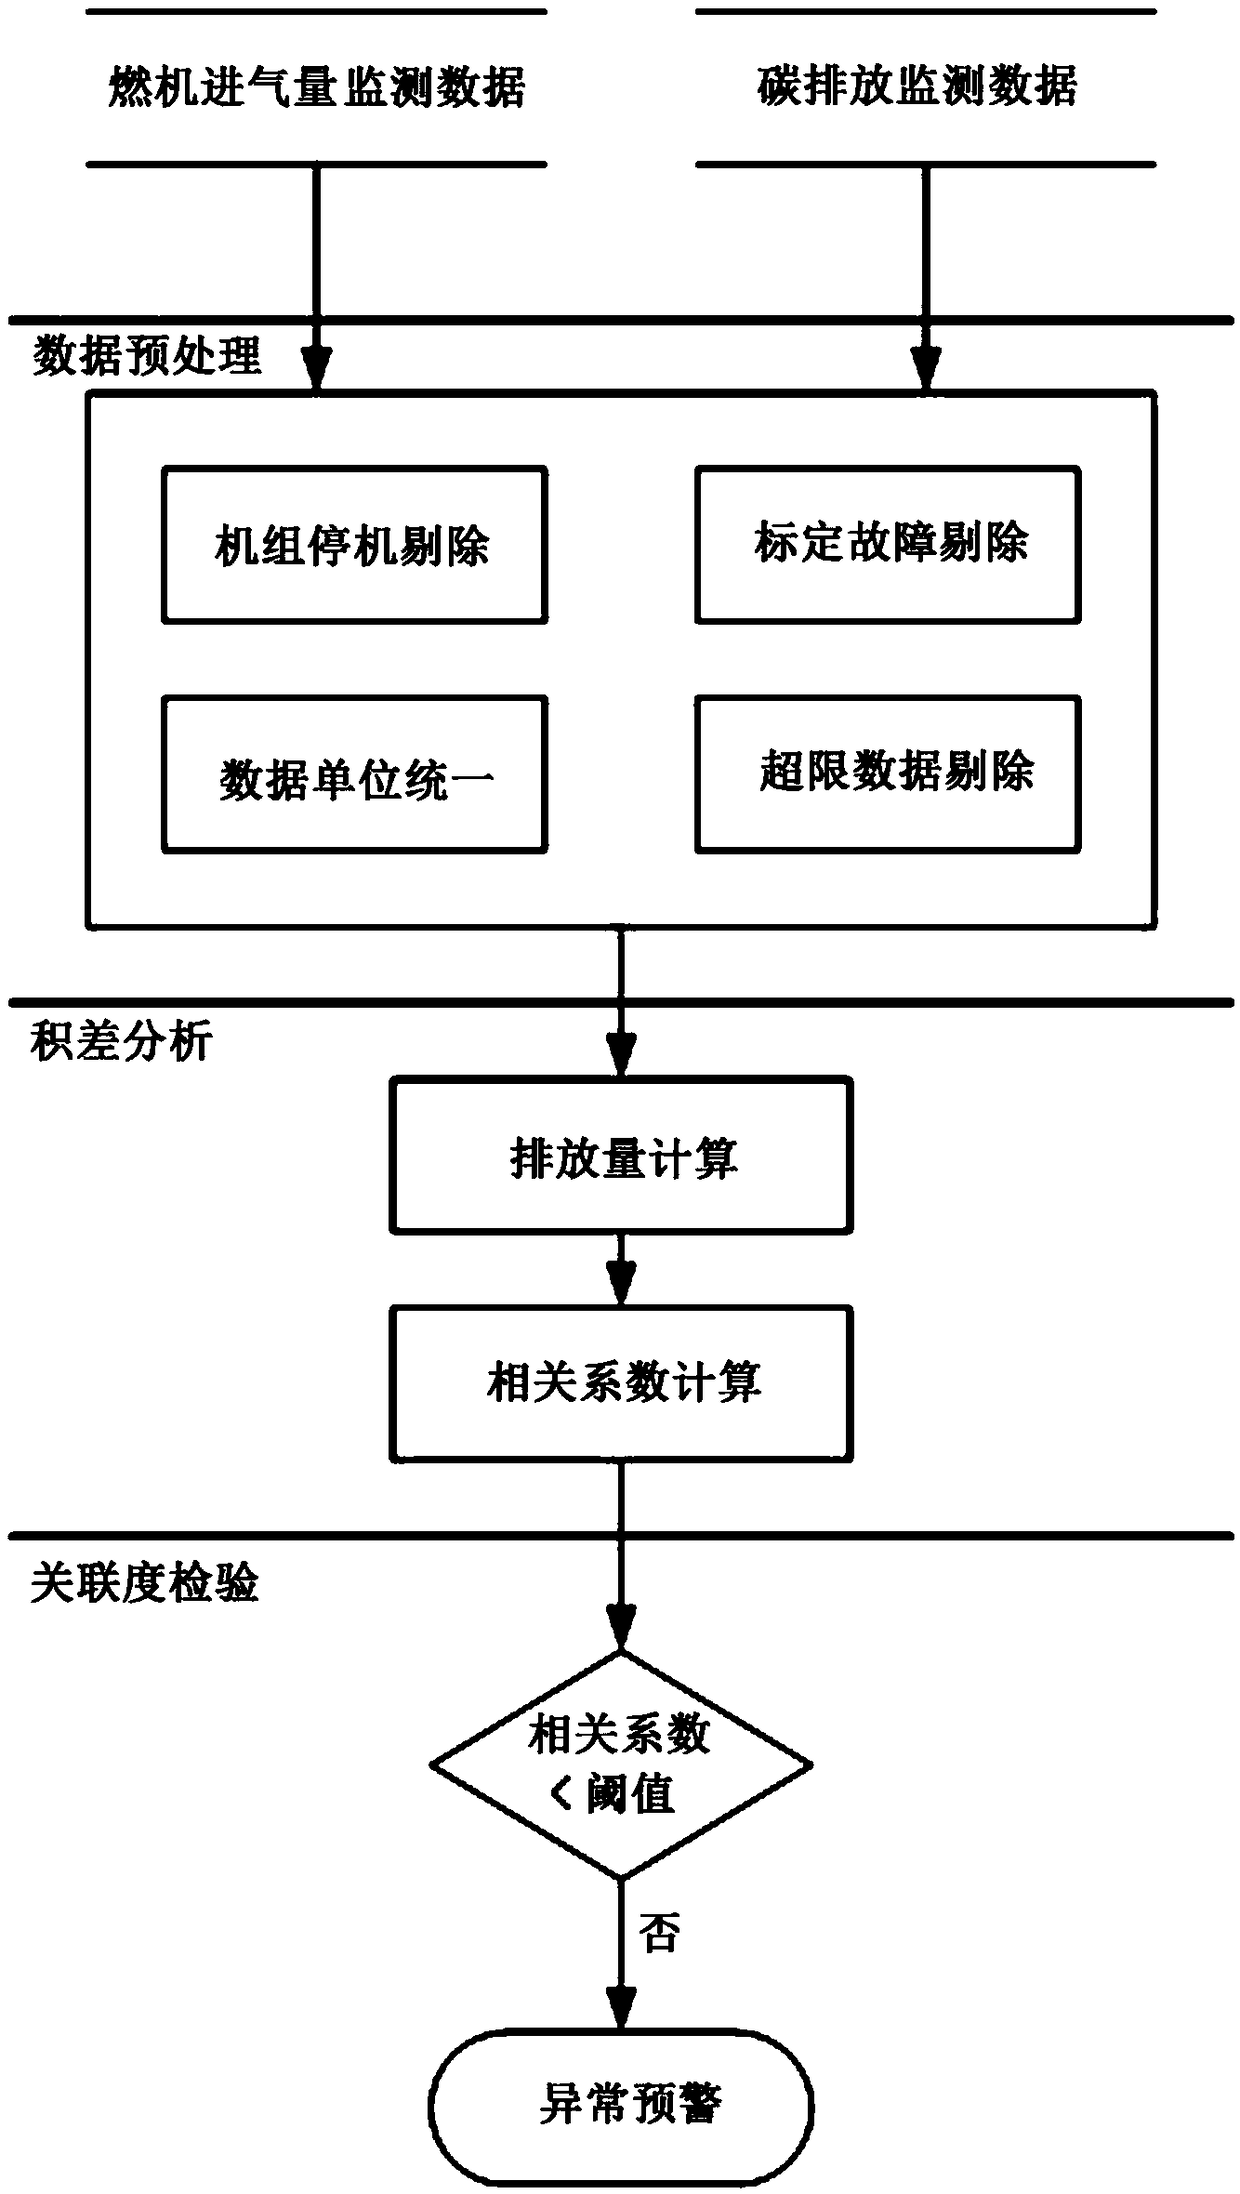
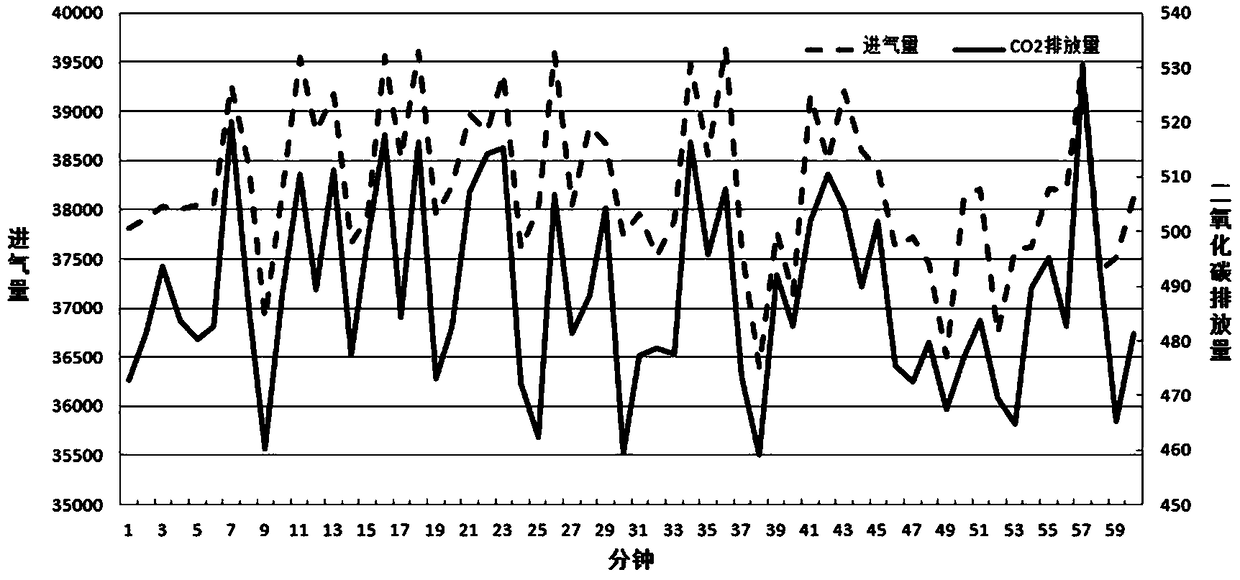
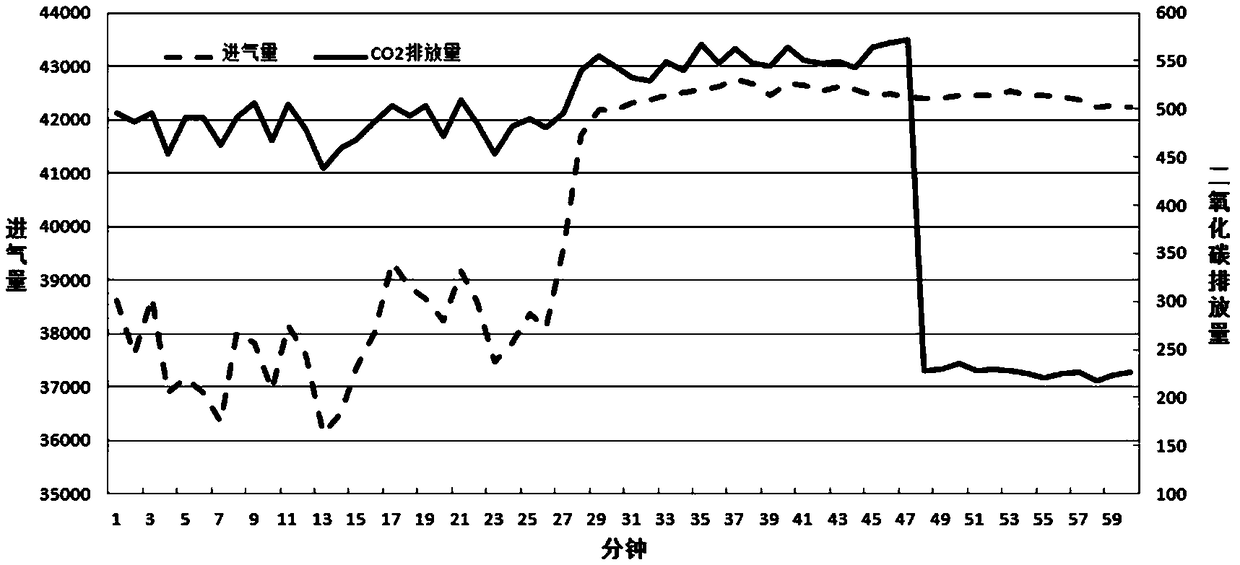
[0042] The following takes a 9F gas-fired unit (test unit) as an example to further describe the present invention in detail, and select the monitoring data of the unit's intake air volume and carbon emission monitoring parameters at 1-minute intervals throughout the day on June 1, 2018 for illustration. The rated load of the gas turbine and steam turbine of the test unit are 475MW and 200MW respectively, and the cross-sectional area of ​​the chimney outlet is 28.26m 2 . see figure 1 , a gas-fired unit carbon emission data correlation inspection method based on cumulative difference analysis of the present invention, comprising the following steps:

[0043] Step 1: Data preprocessing:

[0044] According to the data preprocessing rules, check whether there are shutdowns, calibration failures, and out-of-limit data in the monitoring data, and remove the above-mentioned abnormal data from the monitoring data set. Since the on-site measurement unit of the exhaust gas pressure o...


PUM


Abstract

The invention discloses a method for checking the correlation degree of carbon emission data of a gas unit based on product difference analysis. The method comprises steps that firstly, real-time monitoring data of the carbon emission concentration of the gas unit is converted into instantaneous carbon emission data; secondly, a correlation coefficient between the intake air volume of the gas unitand the carbon dioxide emission volume is calculated through the product difference analysis method; and lastly, according to the correlation coefficient, rationality of correlation between the carbon emission monitoring data is determined, and abnormality of the carbon emission data is investigated. The method is advantaged in that calculation logic is simple, the method can be applied to onlinefield monitoring, abnormal monitoring data is timely discovered, field operating personnel is prompted to investigate a data fault, reliability of the carbon emission monitoring data of the gas unitis guaranteed from the source, moreover, the length of the correlation coefficient time period can be reasonably selected according to the update frequency of the field monitoring data, sample capacity requirements of product difference analysis are not only satisfied, but also the method can be applied to different business scenes such as abnormal data online detection early warning, data validity judgment and parameter correlation analysis.

Description

technical field [0001] The invention belongs to the technical field of continuous monitoring of flue gas emissions, and in particular relates to a method for checking the correlation degree of carbon emission data of a gas-fired unit based on cumulative difference analysis. Background technique [0002] In October 2011, in order to further encourage greenhouse gas-emitting enterprises to reduce carbon dioxide emissions and achieve carbon emission reduction targets at a lower cost, the National Development and Reform Commission officially determined that Beijing, Tianjin, Shanghai, Chongqing, Guangdong, Hubei, and Shenzhen will carry out carbon trading in seven provinces and cities Pilot work, and officially implemented the pilot in 2013. As of September 2017, the cumulative quota trading volume of the carbon emission trading pilot program reached 197 million tons of carbon dioxide equivalent, or about 4.5 billion yuan, and the pilot work has achieved remarkable results. On ...

Claims


Application Information

Patent Timeline
Patent Type & Authority Applications(China)
IPC IPC(8): G01D21/02
CPCG01D21/02
Inventor 孙栓柱孙和泰周春蕾李梦张友卫胡军峰王鹏李逗杨晨琛李春岩潘苗王林许国强王明
Owner JIANGSU FRONTIER ELECTRIC TECH
Learn More