A method and apparatus for visualizing a map of a relational network

A relational network and map technology, applied in the field of relational network visualization map, can solve problems such as lack of scalability, unfriendly UI interface, direct docking of client systems, etc.

Pending Publication Date: 2019-03-22
BANK OF COMMUNICATIONS
View PDF3 Cites 18 Cited by
  • Summary
  • Abstract
  • Description
  • Claims
  • Application Information

AI Technical Summary

Problems solved by technology

[0004] 1) Adobe announced that it will officially stop supporting Flash in 2020, continuing to use it will bring certain security risks, and there is no requirement for subsequent scalability;
[0005] 2) The UI interface is not friendly, and it is difficult to improve the effect of user interaction for users;
[0006] 3) With the development of H5 and more third-party open source JS libraries to choose from, the FLEX project no longer has a competitive advantage
[0008] 1) It is impossible to perform more operations on the existing generated graph relationship, and the operation is cumbersome;
[0009] 2) The user must install netdraw and ucinet6, and the use of the client cannot be directly connected to each system, and can only be visualized by importing specific files;
[0010] 3) It is impossible to customize development for specific usage scenarios, and the flexibility is poor
[0011] Therefore, there are three major pain points in the analysis and processing of interactive data between internal and external customers in the relationship network in the prior art: 1) High labor costs
According to feedback from business personnel, it takes about a week for experienced personnel to use standard drawing tools to construct a complete relationship diagram for customers. In addition to the impact factors such as omissions in manual operations, data errors, and operational errors, rework will occur. Cause longer time-consuming; 2) can not macro overview
Identifying groups, clusters, and relationships through data requires manual experience judgment in the composition work, resulting in many times only focusing on limited areas, and unable to conduct global analysis based on a higher perspective; 3) Difficulty in screening and filtering
The structure of a large number of nodes Figure 1 It has been confirmed that it is impossible to flexibly perform batch screening for specific attributes, and it is difficult to filter interference information

Method used


Image

  • A method and apparatus for visualizing a map of a relational network
  • A method and apparatus for visualizing a map of a relational network
  • A method and apparatus for visualizing a map of a relational network

Examples


Embodiment Construction

[0033] The following will clearly and completely describe the technical solutions in the embodiments of the present invention with reference to the accompanying drawings in the embodiments of the present invention. Obviously, the described embodiments are only some, not all, embodiments of the present invention. Based on the embodiments of the present invention, all other embodiments obtained by persons of ordinary skill in the art without making creative efforts belong to the protection scope of the present invention.

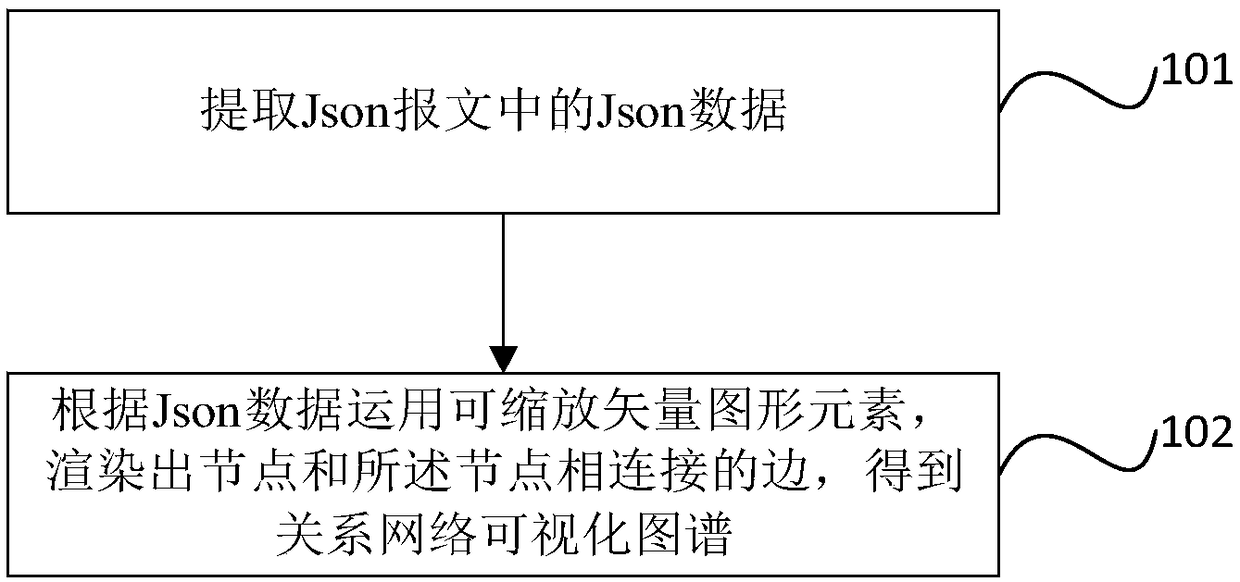
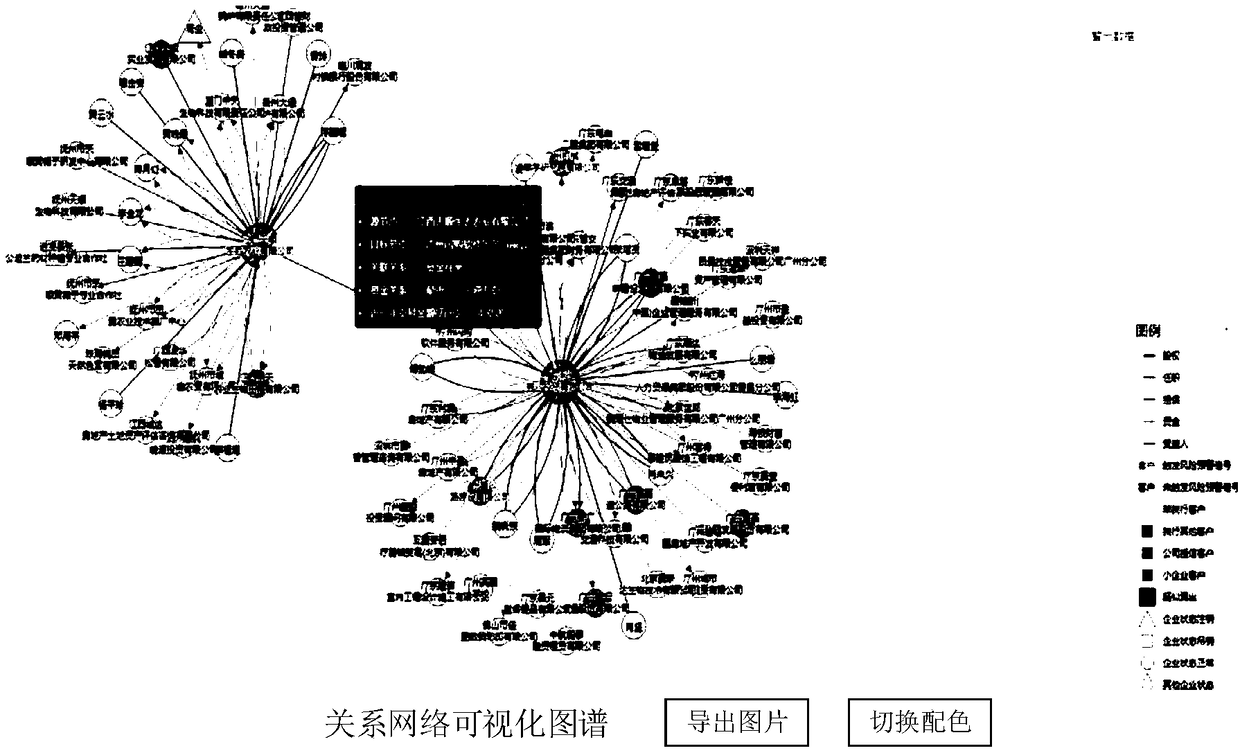
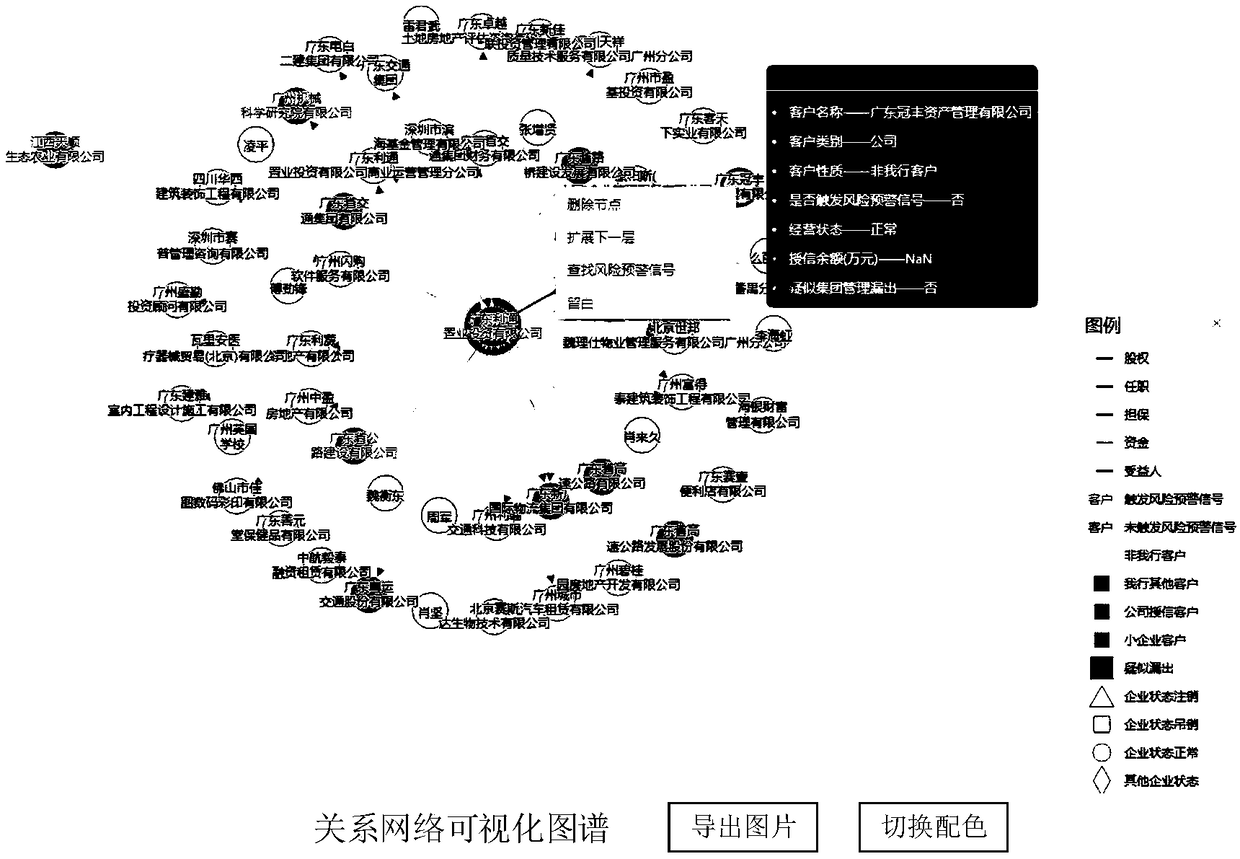
[0034] With the rapid growth of data complexity, accurate data relationship sorting plays an increasingly important role in business decision-making. However, the existing combing of multi-dimensional relationships between enterprises, systems, and people at all levels has high labor costs and cannot be macroscopically overviewed. In order to solve the shortcomings such as difficulty in information screening and filtering, embodiments of the present invention p...


PUM


Abstract

The invention provides a method and apparatus for visualizing a map of a relational network. The method comprises: extracting Json data in a Json message; extracting Json data from the Json message. According to the Json data, taking the scalable vector graph to render the nodes and the connected edges of the nodes, and obtaining the visualization map of the relational network. A method and apparatus for visualizing a map of a relational network A relational network visualization map is rendered by scalable vector graphics, It saves the cost of human resources and can analyze the interactive data between the customers inside and outside the line of the relationship network globally, and can flexibly carry out batch screening for the nodes in the visualization map of the relationship network.

Description

technical field [0001] The invention relates to the field of risk control and monitoring, in particular to a method and device for visualizing graphs of relationship networks. Background technique [0002] With the rapid development of the Internet, the data presents a multi-dimensional explosive growth, and the back-end data of the banking industry is huge and the relationship is complex and diverse. It is very challenging to sort out the multi-dimensional relationships between enterprises, systems, and people at all levels in the ocean of data. It is inevitable that various abnormal situations will occur through manual analysis. Even if it takes a lot of manpower and time to sort out the relationship, it will still exist Potential omissions. It is impossible to dig out hidden clusters, groups, and interactive relationship characteristics from various dimensions at the macro level, thereby leaking out key risk investigation objects. [0003] In response to the above proble...

Claims


Application Information

Patent Timeline
Patent Type & Authority Applications(China)
IPC IPC(8): G06F16/36
Inventor 陈风章万锋姚利虎
Owner BANK OF COMMUNICATIONS
Why Eureka
Try Eureka