Analysis system visually constructing chart

A technology for analyzing systems and charts, applied in visual data mining, structured data retrieval, structured data browsing, etc., can solve problems such as difficult analysis

Inactive Publication Date: 2019-05-03
杭州火树科技有限公司
View PDF6 Cites 8 Cited by
  • Summary
  • Abstract
  • Description
  • Claims
  • Application Information

AI Technical Summary

Problems solved by technology

[0003] The purpose of the present invention is to solve the problem that there is no analysis system that specifically builds big data through visual charts, which makes it difficult to analyze big data visual charts

Method used


Image

  • Analysis system visually constructing chart
  • Analysis system visually constructing chart

Examples


Embodiment Construction

[0047] The present invention will be further described below in conjunction with the accompanying drawings and embodiments.

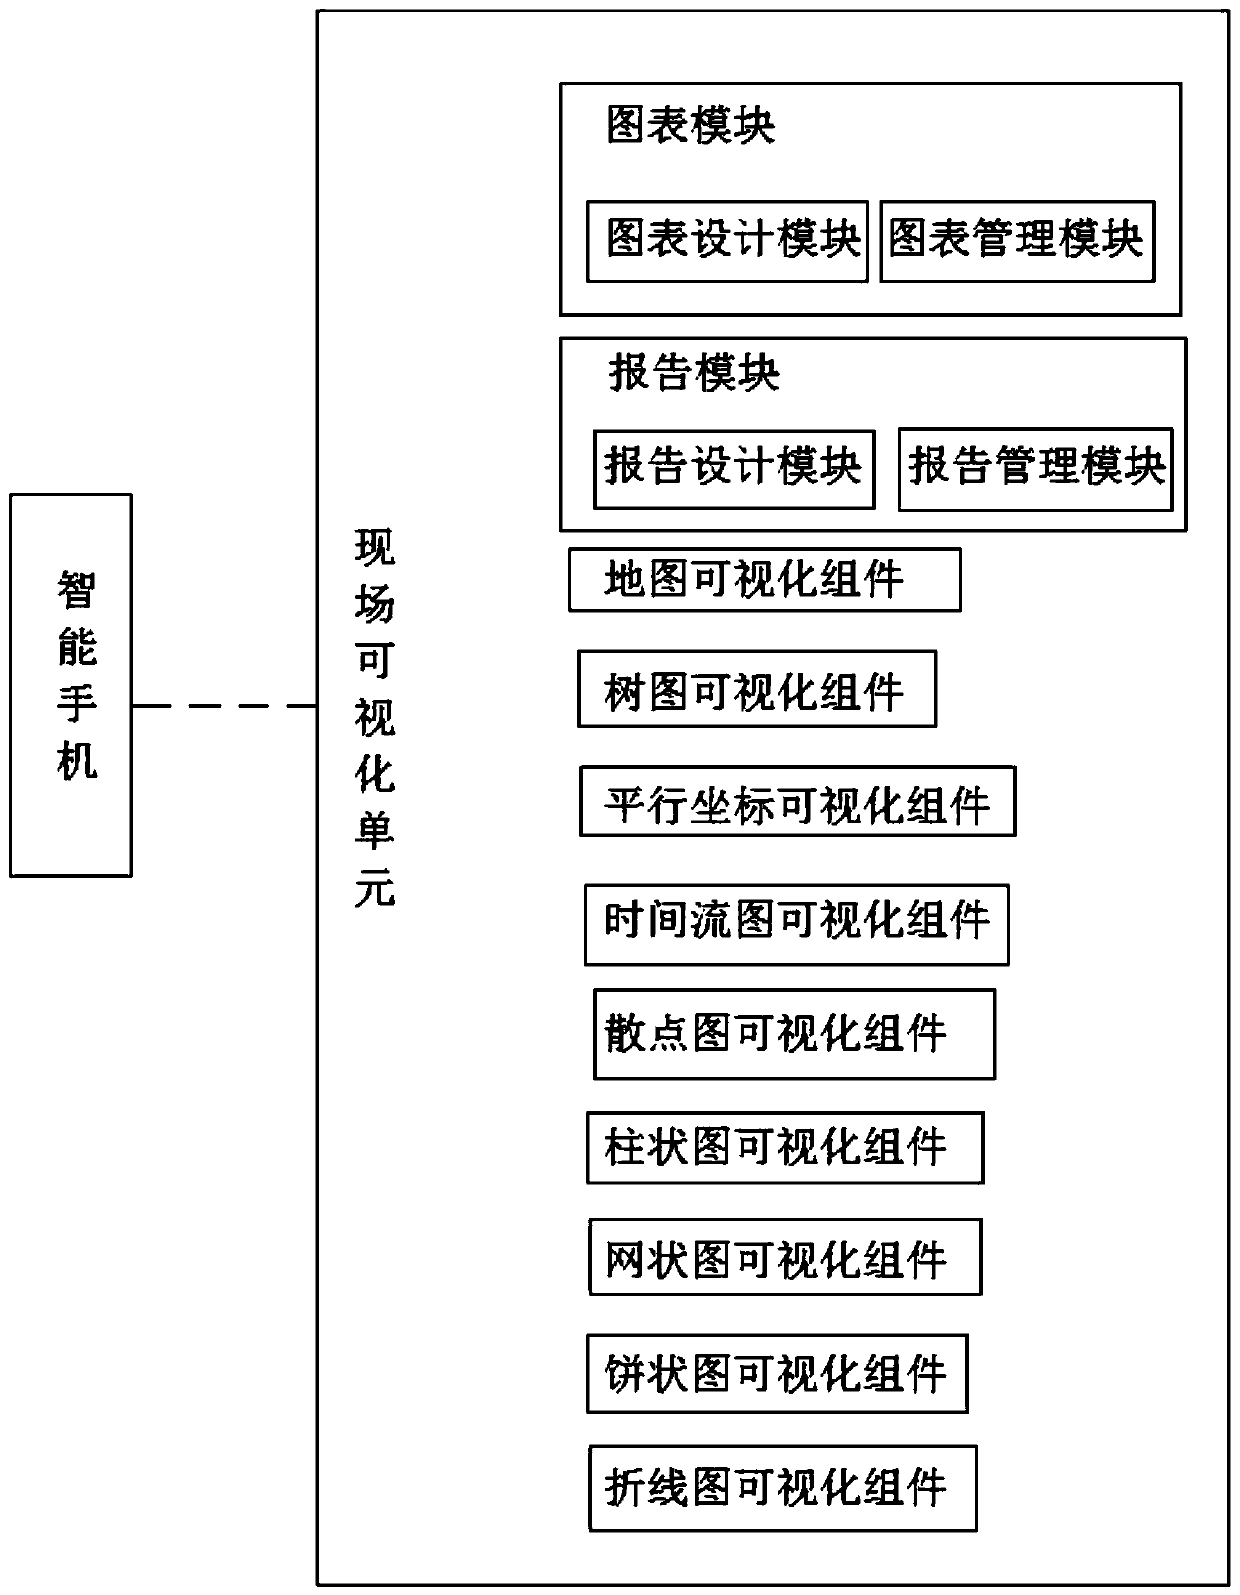
[0048] For an embodiment, an analysis system for visually constructing charts, see figure 1 As shown, the analysis system includes an on-site visualization unit, and the on-site visualization unit includes a chart module, a report module, a map visualization component, a treemap visualization component, a parallel coordinate visualization component, a time flow graph visualization component, a scatter plot visualization component, a histogram Visualization components, grid graph visualization components, pie chart visualization components and line graph visualization components;

[0049] The chart module includes a chart design module and a chart management module; the report module includes a report design module and a report management module;

[0050] The visualization method of the chart design module is to generate a target chart after combining t...


PUM


Abstract

The invention discloses an analysis system for visually constructing a chart. The system belongs to the technical field of visual chart construction and analysis, the data display report is generatedby rapidly constructing a chart through visual operation, programming is not needed, and the system is simple and easy to learn. The analysis system comprises a chart module, a report module, a map visualization assembly, a tree diagram visualization assembly, a parallel coordinate visualization assembly, a time flow diagram visualization assembly, a mesh diagram visualization assembly, a pie diagram visualization assembly and a broken line diagram visualization assembly. The chart module comprises a chart design module and a chart management module; the report module comprises a report designmodule and a report management module; the visualization operation method of the chart design module comprises the following steps: combining model data provided by a data center platform with each component to generate a target chart, and generating an icon corresponding to the target chart; according to the visual operation method of the report design module, icons designed by the chart designmodule are used, and data display reports of a plurality of charts are generated through dragging.

Description

technical field [0001] The invention relates to the technical field of visually constructed chart analysis, in particular to an analysis system for visually constructed charts. Background technique [0002] At present, there is no analysis system that specifically constructs graphs through visualization of big data. Nowadays, more and more attention is paid to the processing and application of big data, but it has become more difficult to display big data intuitively and visually in charts. Because it is a relatively complicated process to turn big data into visual and intuitive charts, and most users do not understand the program, it is very necessary to design an analysis system that visually constructs charts to generate data display reports. Contents of the invention [0003] The purpose of the present invention is to solve the problem that there is no analysis system that specifically builds big data through visual charts, which makes it difficult to analyze big data...

Claims


Application Information

Patent Timeline
IPC IPC(8): G06F16/26G06F17/24
Inventor 黄泽明
Owner 杭州火树科技有限公司
Why Eureka
Try Eureka