Energy storage capacity optimization method for wind-solar combined power generation system
A combination of wind and wind and power generation system technology, applied in wind power generation, collectors, electric vehicles, etc., can solve problems such as complex control methods, wind and light abandonment, etc.
- Summary
- Abstract
- Description
- Claims
- Application Information
AI Technical Summary
Problems solved by technology
Method used
Image

Examples
Embodiment
[0106] Analysis of Output Characteristics of Wind-wind Combined Power Generation System
[0107] Table 1 and Table 2 represent the parameters of photovoltaic cells and wind turbines in a certain area, respectively.
[0108] Table 1 Photovoltaic cell parameters in a certain area
[0109]
[0110] Table 2 Fan parameters in a certain area
[0111]
[0112]
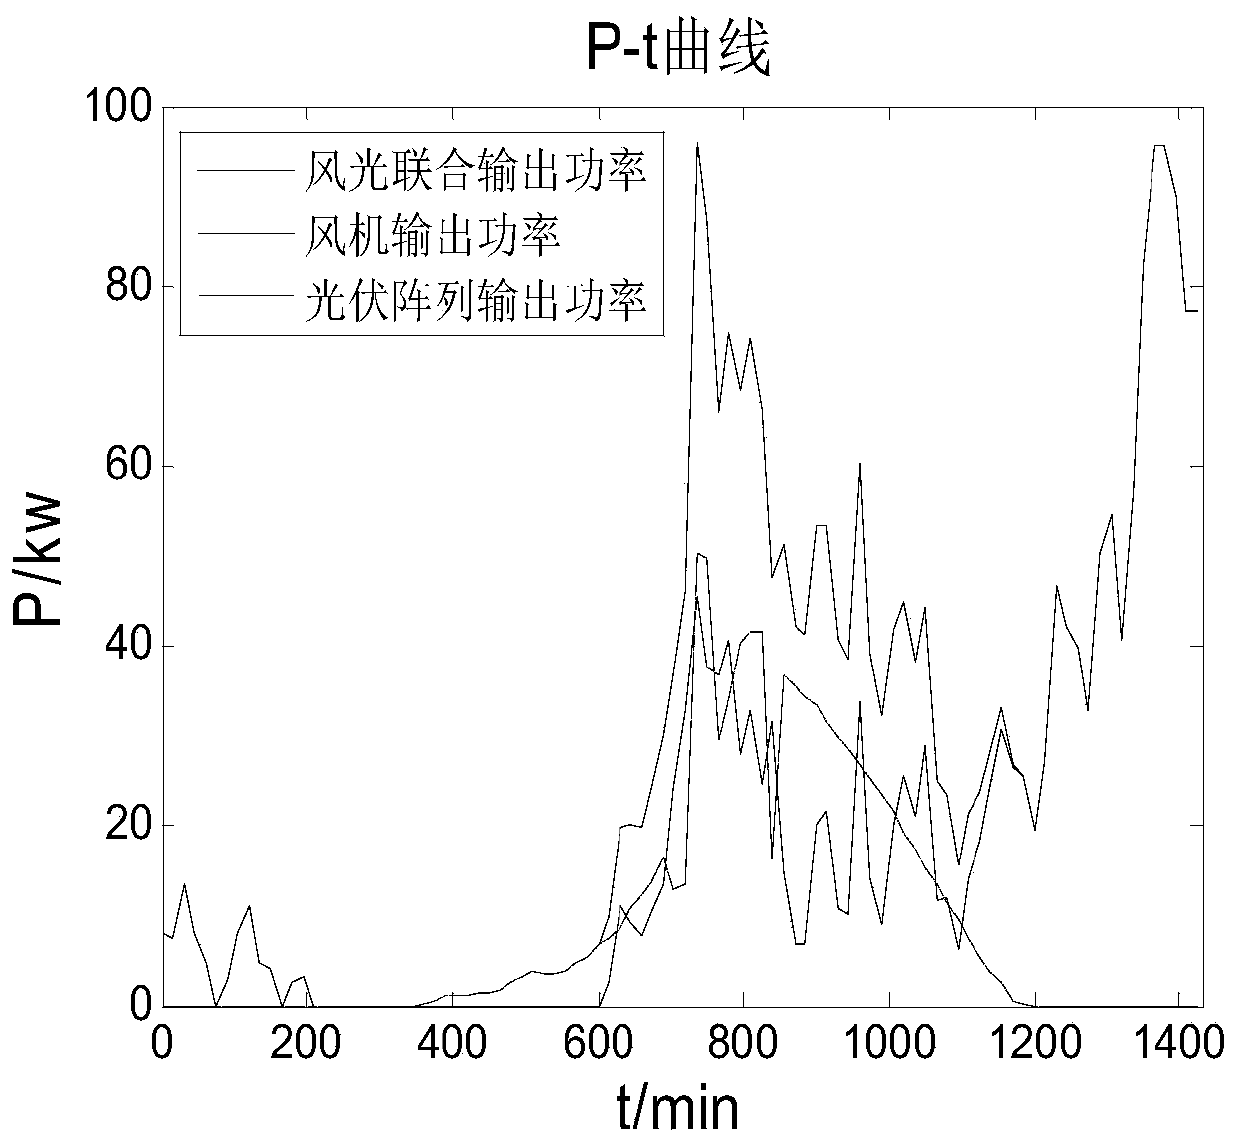
[0113] Select the sampling data of wind speed, light intensity and temperature in a certain area for 24 hours a day as the research object, and the sampling period is 15 minutes. The obtained system output power curve is as follows: figure 2 Shown:
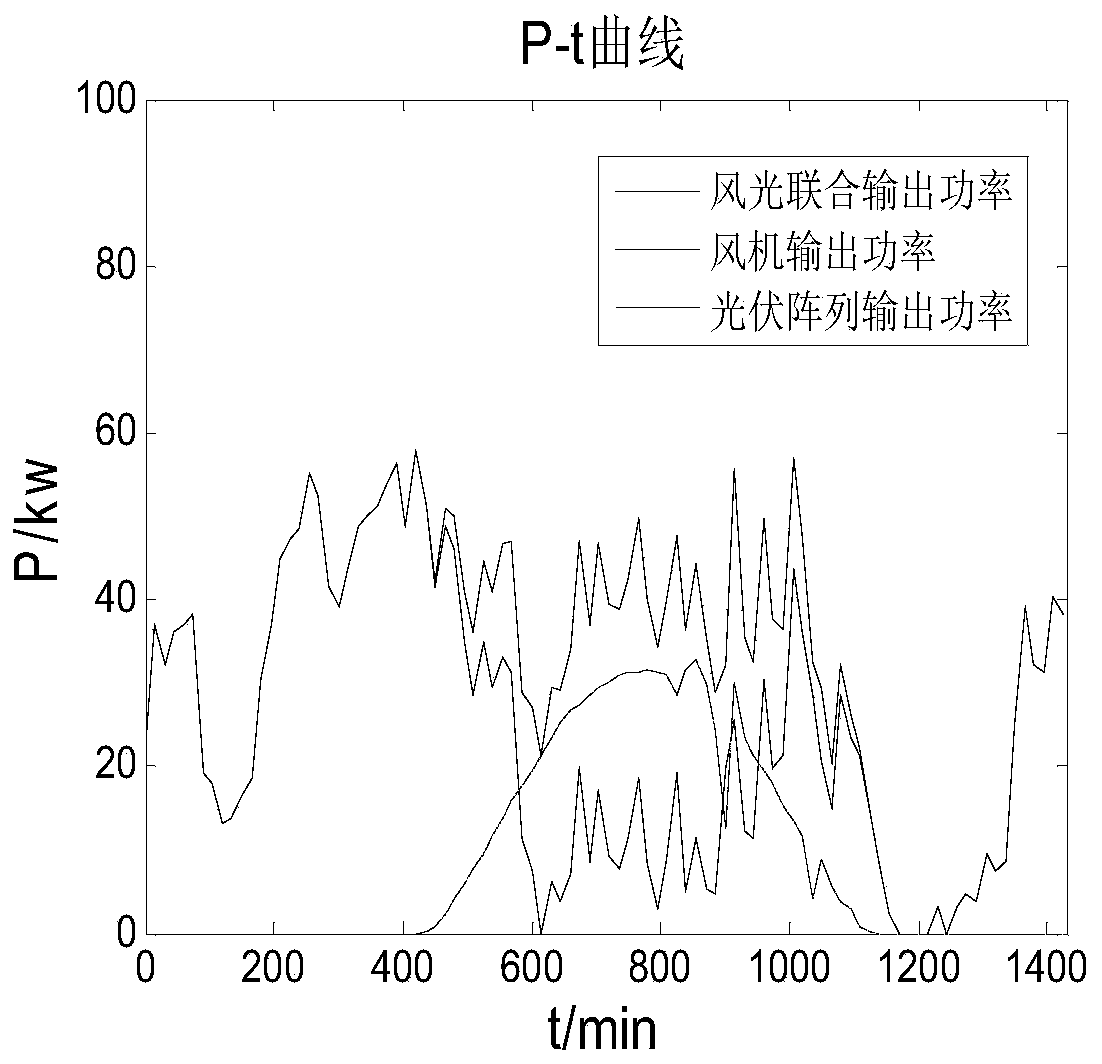
[0114] Since the wind speed, light intensity and temperature are very different in different seasons, it has a great influence on the fluctuation of the output power of the wind-solar combined power generation system. image 3 It is the system output power curve graph in other seasons.
[0115] Compared figure 1 and figure 2 It can be seen that the output power o...
PUM
 Abstract
Description
Claims
Application Information
 - Generate Ideas
- Intellectual Property
- Life Sciences
- Materials
- Tech Scout
- Unparalleled Data Quality
- Higher Quality Content
- 60% Fewer Hallucinations
Browse by: Latest US Patents, China's latest patents, Technical Efficacy Thesaurus, Application Domain, Technology Topic, Popular Technical Reports.
© 2025 PatSnap. All rights reserved.Legal|Privacy policy|Modern Slavery Act Transparency Statement|Sitemap|About US| Contact US: help@patsnap.com