Intelligent event analysis method and device and user equipment

An intelligent analysis and event technology, applied in the field of event analysis, can solve problems such as impact analysis and information that cannot be displayed objectively, and achieve the effect of rapid analysis and intuitive display

Pending Publication Date: 2019-06-18
成都小步创想慧联科技有限公司
View PDF5 Cites 3 Cited by
  • Summary
  • Abstract
  • Description
  • Claims
  • Application Information

AI Technical Summary

Problems solved by technology

[0005] This application provides an event intelligent analysis method, device and user equipment to solve the problem that the

Method used


Image

  • Intelligent event analysis method and device and user equipment
  • Intelligent event analysis method and device and user equipment
  • Intelligent event analysis method and device and user equipment

Examples


Embodiment 1

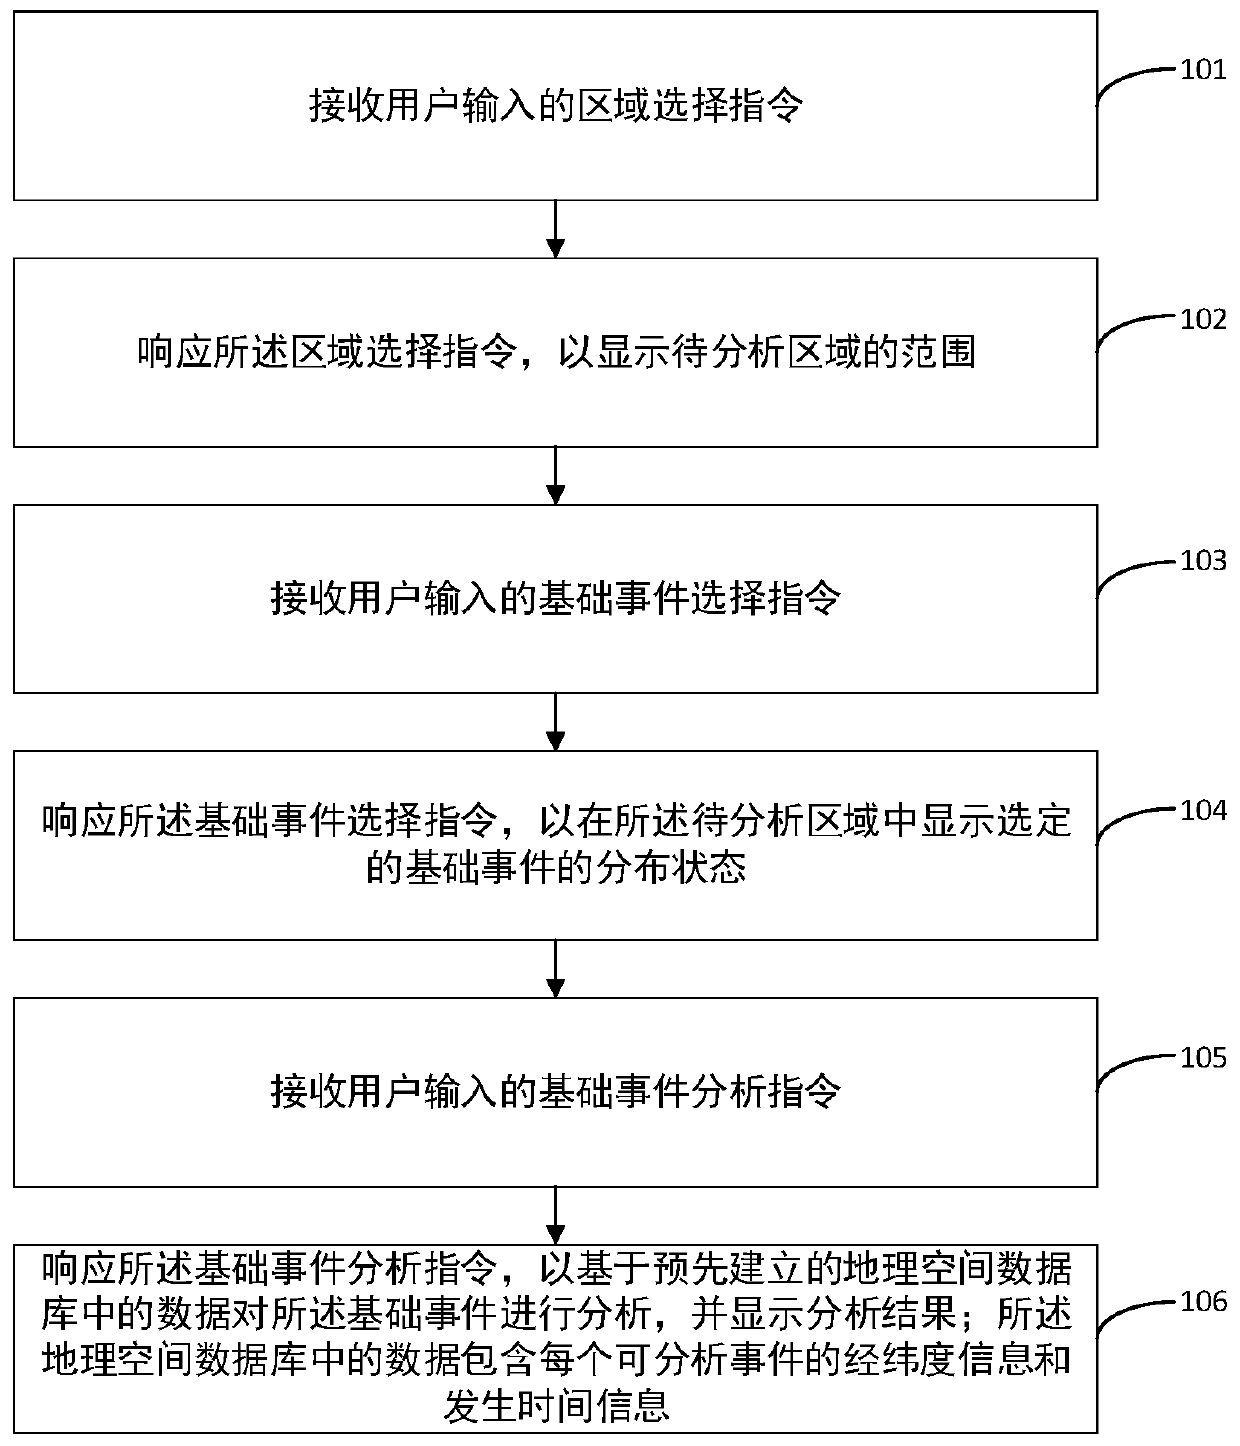
[0063] see figure 1 , figure 1 It is a flow chart of an event intelligent analysis method provided in the embodiment of the present application. Such as figure 1 As shown, the method of the present embodiment includes the following steps:

[0064] S101: Receive an area selection instruction input by a user;

[0065] Specifically, this step may include: displaying all analyzable areas to the user in the form of a map on the computer screen, and the user may zoom in and out of the scale of the map through operations to display a larger area or more detailed area information for preliminary selection The area to be analyzed; the user can then input text or graphic information to further select the area to be analyzed.

[0066] In some embodiments, the user can select a certain administrative area by inputting text information. For example, if the area to be analyzed by the user is Chaoyang District, Beijing, the user can initially select Beijing by dragging the map and zoomin...

Embodiment 2

[0081] Assuming that the user wants to analyze the complaints of citizens in Chaoyang District, Beijing about health problems, the computer program performs the following steps:

[0082] Receive the instruction of selecting Beijing Chaoyang District input by the user (ie step S101);

[0083] After responding to the above-mentioned area selection instruction, the outline range of Chaoyang District, Beijing is displayed in the form of a map on the computer screen (ie step S102);

[0084] Receive an instruction from the user to choose to complain about hygiene problems (ie step S103);

[0085] After responding to the above-mentioned instructions for choosing to complain about health problems, the distribution status on the map of all citizens complaining about health problems in Chaoyang District, Beijing is displayed on the computer screen in the form of a map (ie step S104);

[0086] Receiving an analysis instruction for complaining about hygiene problems input by the user (ie...

Embodiment 3

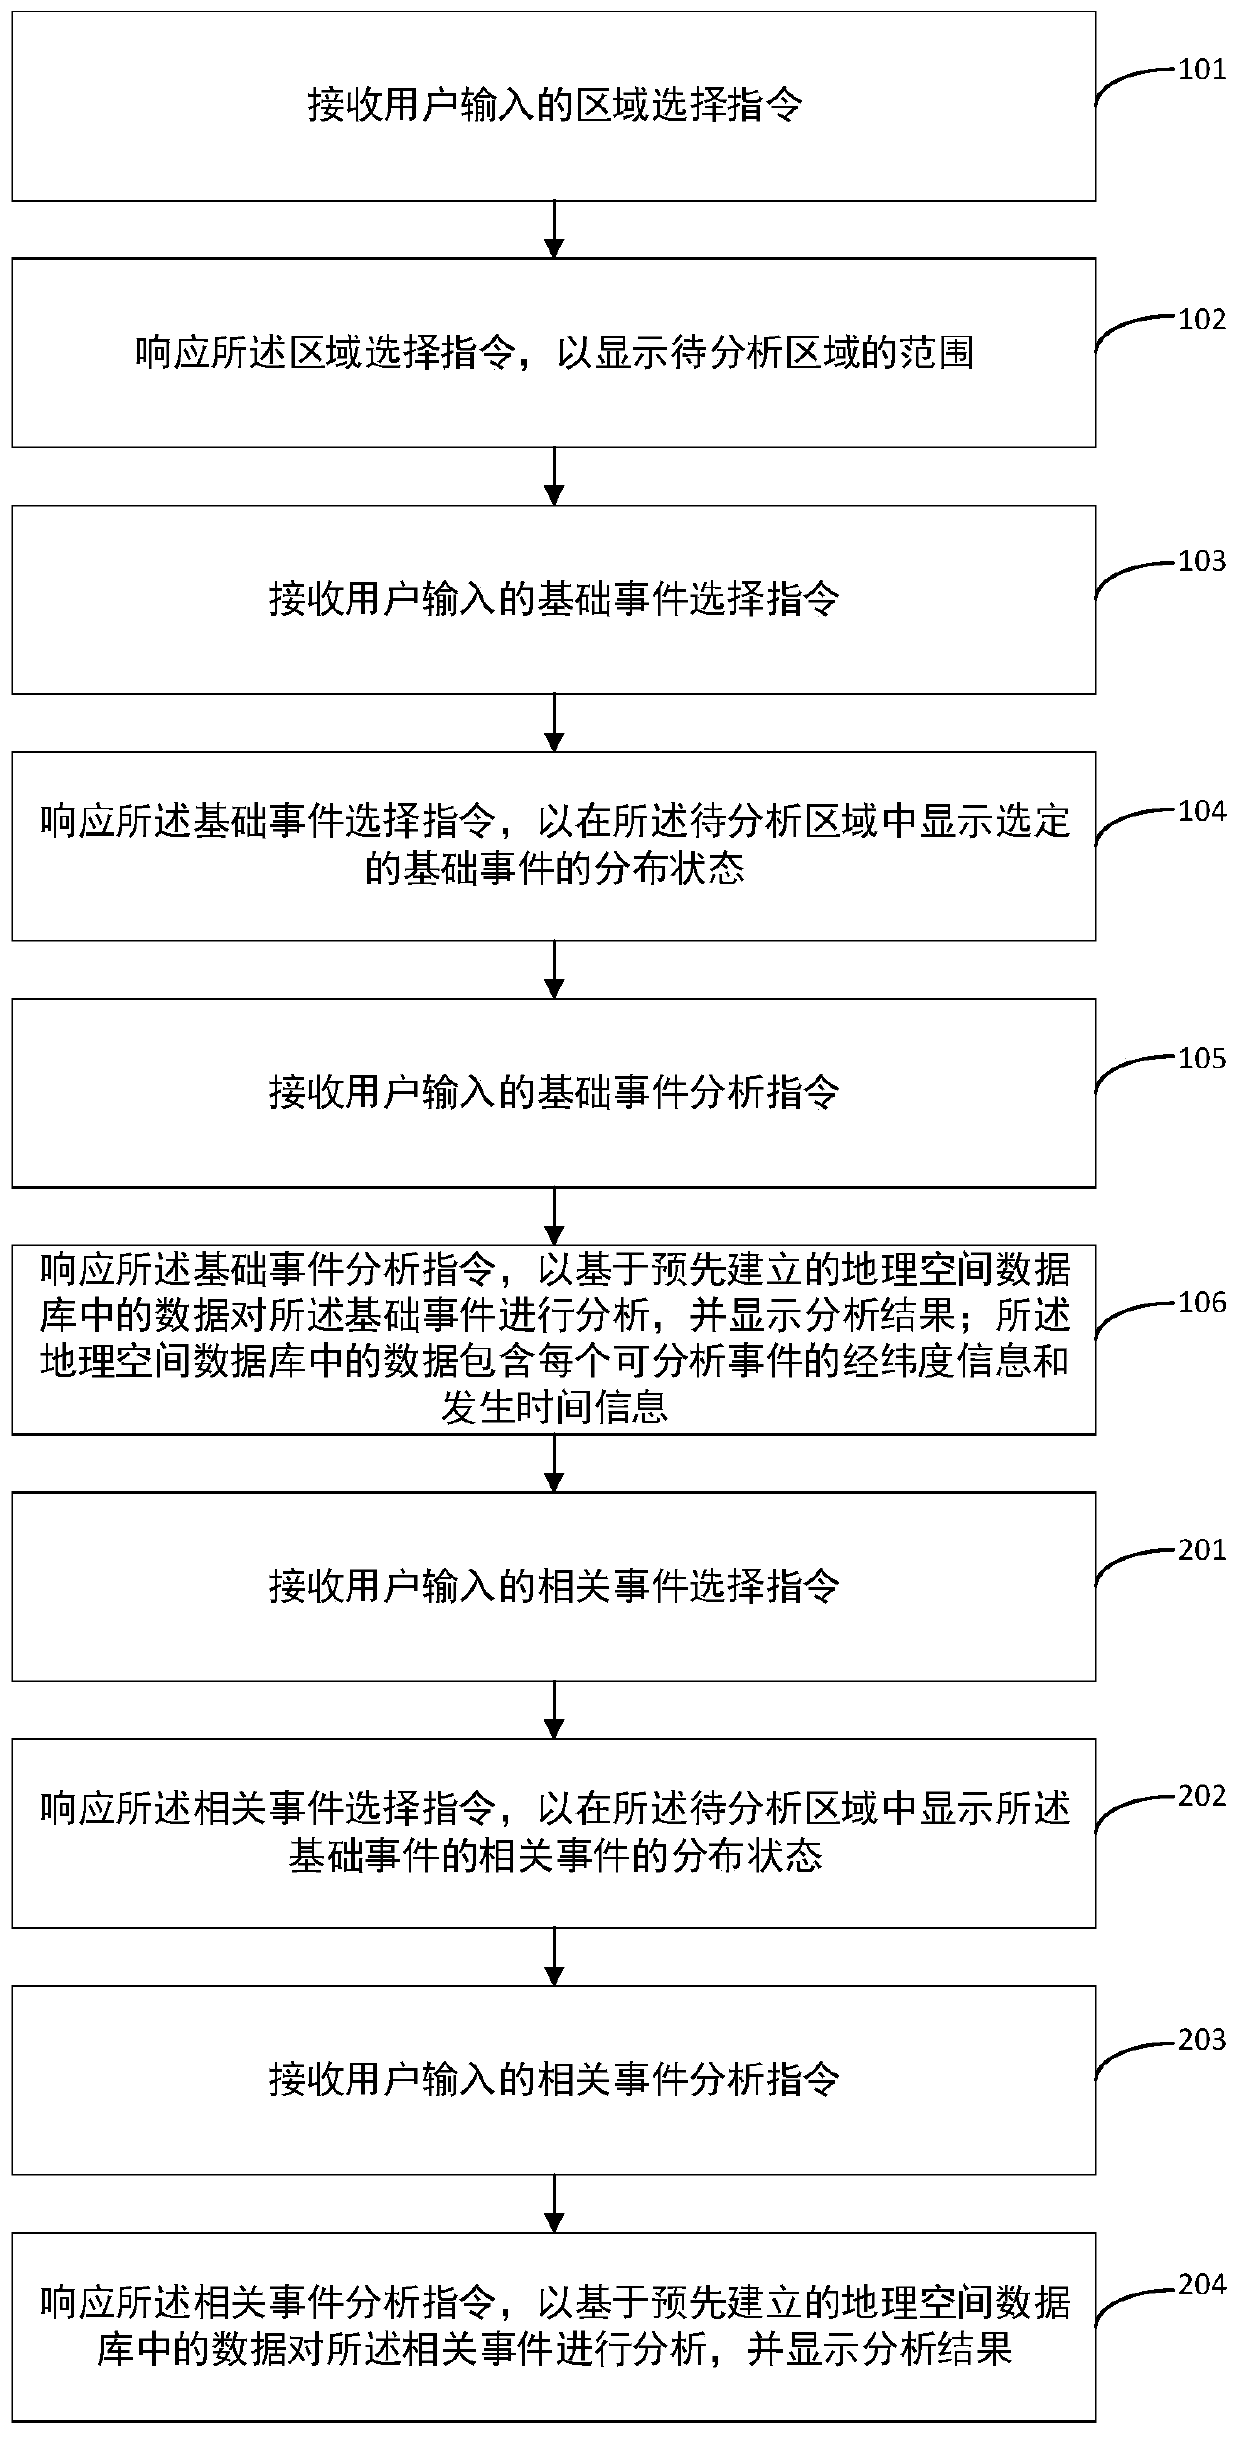
[0095] see figure 2 , figure 2 It is a flow chart of another intelligent event analysis method provided by the embodiment of the present application. Such as figure 2 As shown, the method provided in this embodiment includes:

[0096] S101: Receive an area selection instruction input by a user;

[0097] S102: Respond to the area selection instruction to display the range of the area to be analyzed;

[0098] S103: Receive a basic event selection instruction input by the user;

[0099] S104: Responding to the basic event selection instruction, to display the distribution status of the selected basic event in the area to be analyzed;

[0100] S105: Receive a basic event analysis instruction input by the user;

[0101] S106: Respond to the basic event analysis instruction, to analyze the basic event based on the data in the pre-established geospatial database, and display the analysis results; the data in the geospatial database includes the latitude and longitude of each...


PUM


Abstract

The invention relates to an intelligent event analysis method and device and user equipment. The method comprises the following steps: receiving an area selection instruction input by a user; Responding to the area selection instruction to display the range of the to-be-analyzed area; Receiving a basic event selection instruction input by a user; Responding to the basic event selection instructionto display the distribution state of the selected basic event in the to-be-analyzed area; Receiving a basic event analysis instruction input by a user; Responding to the basic event analysis instruction to analyze the basic event based on data in a pre-established geographic space database, and displaying an analysis result; Wherein the data in the geographic space database comprises latitude andlongitude information and occurrence time information of each analyzable event. By adopting the scheme provided by the embodiment of the invention, the geographic position and other information of the event can be visually displayed, and the event can be rapidly analyzed on the basis of the displayed information.

Description

technical field [0001] The present application relates to the field of event analysis, in particular to an event intelligent analysis method, device and user equipment. Background technique [0002] When people analyze an event, they usually analyze why the event happened, why it happened here, and where the event occurred frequently by analyzing the time and place where the event occurred. In the prior art, when people record an event that has occurred, they usually use written records. Therefore, when analyzing the event, analysts can only analyze the information in the written records. [0003] For example, for an event about a traffic jam, people usually record the starting point and end point of the traffic jam, such as a certain section of a street, as well as information such as the start time and duration of the traffic jam, so as to propose Reasonable improvement plans to avoid the recurrence of the same event, or reduce the frequency of occurrence. However, analy...

Claims


Application Information

Patent Timeline
IPC IPC(8): G06F16/29
Inventor 曾鹏举
Owner 成都小步创想慧联科技有限公司
Why Eureka
Try Eureka