Stock prediction method, system and device based on affinity propagation and medium

A technology of neighbor propagation and prediction method, applied in prediction, character and pattern recognition, instruments and other directions, can solve the problems of "overfitting, inability to parallel processing, slow learning speed, etc., to improve the prediction accuracy, improve the The speed of training, the effect of improving efficiency

Inactive Publication Date: 2019-10-18
WUHAN INSTITUTE OF TECHNOLOGY
0 Cites 0 Cited by

AI-Extracted Technical Summary

Problems solved by technology

Commonly used algorithms include: BP neural network algorithm, RNN cyclic neural network algorithm and LSTM neural network algorithm, etc. Among them, BP neural network algorithm has strong nonlinear mapping ability and self-learning ability, but the learning speed is slow and prone to " Overfitting” phenomenon; the RNN cyclic neural network algorithm will not only le...

Method used

According to clustering result, select the sample stock of preset quantity in the described cluster group of stock to be predicted, and all corresponding first eigenvector ups and downs differences and/or all second eigenvectors ups and downs difference as The sample label is convenient to ensure that the stock trend prediction model based on the support vector machine training method has high prediction accuracy and high parallelism.
By processing the eigenvector set in the historical transaction data of any stock, the weaker target eigenvector set of correlation can be analyzed, thereby obtaining the target eigenvector set corresponding to this any stock, by this The set of target eigenvectors corresponding to any stock can directly obtain the set of target eigenvectors corresponding to the other remaining stocks; through the set of target eigenvectors corresponding to each stock, the relationship between all the eigenvectors of the stock can be expressed, It can also reduce the amount of calculation and calculation time, and can also improve the speed of subsequent support vector machine training based on all target feature vector sets corresponding to all stocks, occupying a small amount of memory, so as to facilitate the improvement of the efficiency of the entire stock ups and downs trend prediction process; through The nearest neighbor propagation method performs the nearest neighbor propagation clustering analysis on all stocks, and can cluster stocks with large similarities, that is, stocks with the same volatility, in the same cluster, which is convenient for subsequent support vector machine training based on the clustering results. The parallelism is high, which means that the obtained stock trend prediction model can accurately predict the ups and downs of the stock to be predicted, and significantly improve the prediction accuracy; wherein, the stock to be predicted can be any of the stocks in S1 A stock may also be a stock of the same type as one of the multiple stocks; wherein, the preset time may be selected according to actual conditions.
Need to determine kernel function before carrying out support vector machine training, and because there is certain error in the known data of determining kernel function, therefore need to introduce penalty factor to correct, thus make the stock trend that obtains after training in the present embodiment The prediction model is more accurate in predicting and classifying stock ups and downs; since each parameter combination is independent of each other and does not affect each other in the process of obtaining parameters by the grid search me...

Abstract

The invention relates to a stock prediction method, system and device based on affinity propagation, and a medium, and the method comprises the steps: obtaining the historical transaction data of a plurality of stocks, and processing the historical transaction data of any one stock to obtain a target feature vector set of the stock; directly obtaining target feature vector sets of other remainingstocks according to the target feature vector set of the stock; performing affinity propagation clustering analysis on all historical transaction data according to all the target feature vector sets by adopting an affinity propagation method to obtain a clustering result; selecting a preset number of sample stocks in the cluster to which the to-be-predicted stocks belong according to the clustering result, and obtaining a stock trend prediction model according to the target feature vector set and historical transaction data corresponding to the sample stocks based on a support vector machine training method; and predicting the to-be-predicted stock according to the stock trend prediction model to obtain a prediction result. The invention provided by the invention has the advantages of relatively low operand, relatively short operation time, small occupied memory, high parallelism and high prediction accuracy.

Application Domain

FinanceForecasting +1

Technology Topic

Stock predictionAffinity propagation +8

Image

  • Stock prediction method, system and device based on affinity propagation and medium
  • Stock prediction method, system and device based on affinity propagation and medium
  • Stock prediction method, system and device based on affinity propagation and medium

Examples

  • Experimental program(3)

Example Embodiment

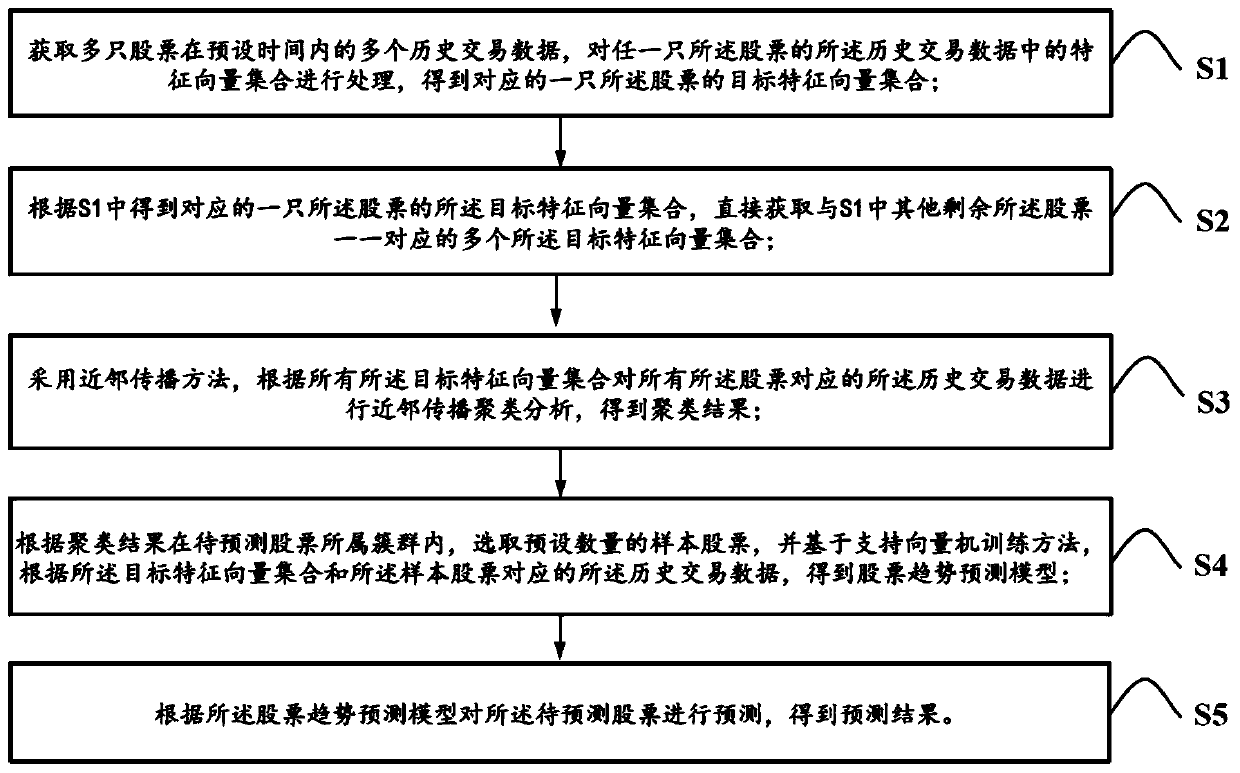
[0084] Embodiment one, as figure 1 As shown, a stock prediction method based on neighbor propagation includes the following steps:
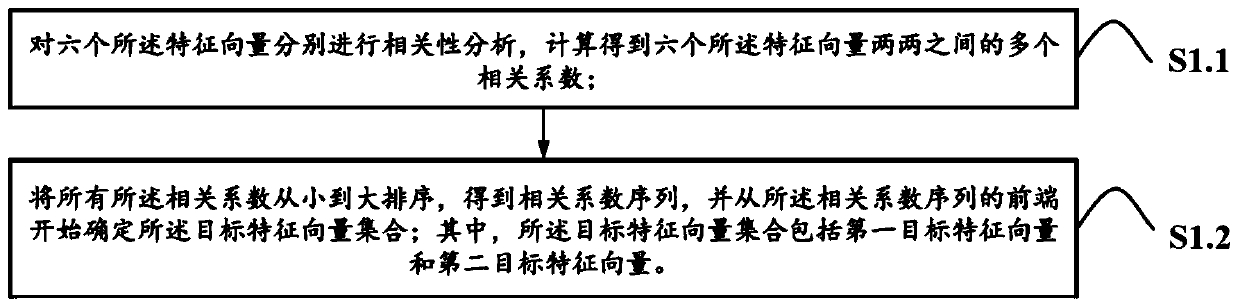
[0085] S1: Obtain multiple historical transaction data of multiple stocks within a preset time, process the feature vector set in the historical transaction data of any one of the stocks, and obtain the target feature of the corresponding one of the stocks collection of vectors;
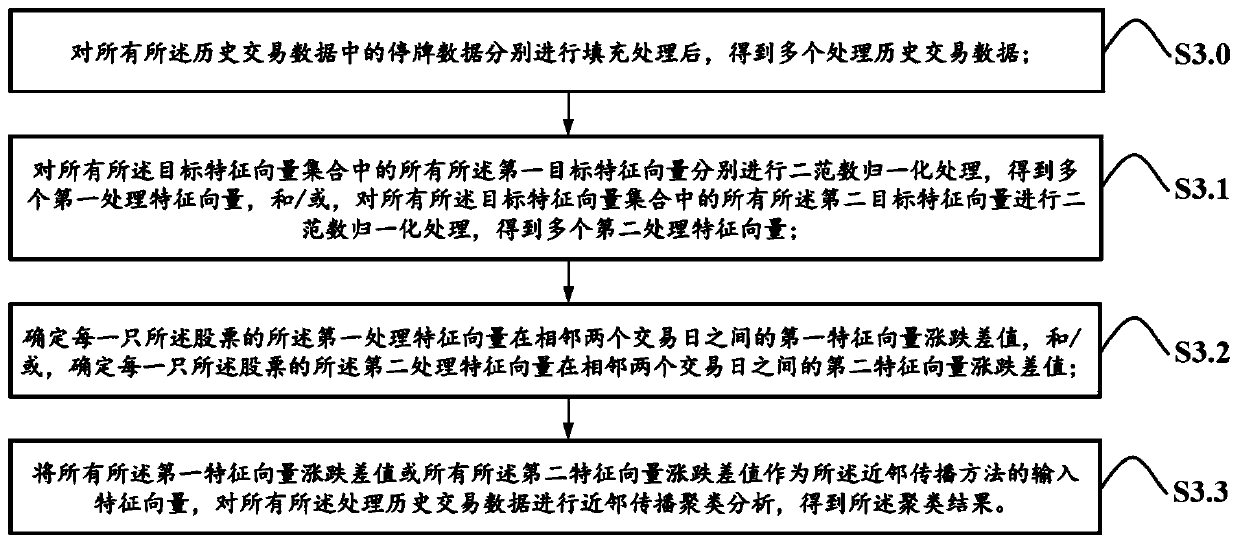
[0086] S2: According to the target feature vector set of a corresponding stock obtained in S1, directly obtain a plurality of target feature vector sets corresponding to other remaining stocks in S1; S3: Use neighbor propagation method, performing a neighbor propagation clustering analysis on the historical transaction data corresponding to all the stocks according to the set of all target feature vectors to obtain a clustering result;
[0087] S4: According to the clustering results, select a preset number of sample stocks in the clusters of the stocks to be predicted, and based on the support vector machine training method, according to the target feature vector set and the historical transaction data corresponding to the sample stocks , get the stock trend prediction model;
[0088] S5: Predict the stock to be predicted according to the stock trend prediction model, and obtain a prediction result.
[0089] By processing the set of eigenvectors in the historical transaction data of any stock, we can analyze the set of target eigenvectors with weak correlation, so as to obtain the set of target eigenvectors corresponding to any stock. The corresponding target eigenvector set can directly obtain the one-to-one corresponding target eigenvector set of other remaining stocks; the target eigenvector set corresponding to each stock can not only express the relationship between all the eigenvectors of the stock, but also reduce The calculation amount and calculation time can also improve the speed of subsequent support vector machine training based on all target feature vector sets corresponding to all stocks, and occupy a small memory, so as to improve the efficiency of the entire stock ups and downs trend prediction process; through the nearest neighbor propagation method Performing neighbor propagation cluster analysis on all stocks can cluster stocks with high similarity, that is, stocks with the same volatility, in the same cluster, which is convenient for subsequent support vector machine training based on the clustering results, and can be parallelized High, which means that the obtained stock trend prediction model can accurately predict the ups and downs of the stocks to be predicted, and significantly improve the prediction accuracy; where the stock to be predicted can be any one of the stocks in S1 , may also be a stock of the same type as one of the multiple stocks; wherein, the preset time may be selected according to actual conditions.
[0090] Specifically, this embodiment uses the tushare interface module to collect historical transaction data of all A shares from September 10, 2008 to September 10, 2018, and deletes stocks that are less than 10 years old, stocks that have been delisted, and stocks that have been suspended for a long time For the data corresponding to stocks, a total of historical transaction data corresponding to 3617 A-share stocks were collected. After deleting the unqualified stocks, there were still historical transaction data corresponding to 1651 stocks.
[0091] Preferably, the eigenvector set includes six eigenvectors, which are respectively opening price, closing price, highest price, lowest price, transaction volume and transaction value;
[0092] like figure 2 As shown, in S1, the specific steps of obtaining the set of target feature vectors include:
[0093] S1.1: Carry out correlation analysis on the six eigenvectors respectively, and calculate multiple correlation coefficients between two of the six eigenvectors;
[0094] The specific formula for calculating the correlation coefficient between the i-th eigenvector and the j-th eigenvector is:
[0095]
[0096] Among them, v i is the i-th eigenvector, v j is the jth eigenvector, n ij is the correlation coefficient between the i-th eigenvector and the j-th eigenvector, u i is the expected value of the i-th eigenvector, u j is the expected value of the jth eigenvector, D(v i ) is the variance of the i-th eigenvector, D(v j ) is the variance of the jth described eigenvector, and E ( ) is to seek the mathematical expectation operation;
[0097] S1.2: Sort all the correlation coefficients from small to large to obtain a correlation coefficient sequence, and determine the target feature vector set from the front end of the correlation coefficient sequence; wherein, the target feature vector set includes the first target eigenvector and the second target eigenvector.
[0098] The correlation coefficient between the six eigenvectors in the eigenvector set can be calculated by the formula (1), and the correlation coefficient can be accurately judged according to the order of the small arrivals. .
[0099] Specifically, two corresponding target feature vectors can be selected from the front end of the correlation coefficient sequence, that is, the first target feature vector and the second target feature vector, so as to express according to the first target feature vector and the second target feature vector Several other feature vectors that have a strong correlation with the two respectively greatly reduce the amount of calculation, calculation time and memory usage, and improve the efficiency of the entire stock ups and downs trend prediction.
[0100] Specifically, a stock selected in this embodiment is CITIC Securities, and the correlation analysis is performed on its corresponding 6 eigenvectors, and the correlation coefficients between two eigenvectors calculated by using formula (1) are shown in Table 1 Show.
[0101] Table 1 Correlation coefficient table between pairs of eigenvectors corresponding to CITIC Securities
[0102]
[0103] Analysis of Table 1 shows that the correlation coefficient between the opening price, closing price, highest price, and lowest price is close to 1, indicating that these feature vectors are highly correlated, and there is also a strong correlation between trading volume and turnover, while opening Price, closing price, highest price, and lowest price have little correlation with trading volume and turnover; therefore, the set of target feature vectors only needs two target feature vectors, that is, the closing price is selected as the first target feature vector, and the transaction The quantity is used as the second target feature vector.
[0104] Preferably, as image 3 As shown, prior to S3 also included:
[0105] S3.0: After filling the trading suspension data in all the historical transaction data respectively, a plurality of processed historical transaction data are obtained.
[0106] Due to the suspension data in the historical transaction data, the suspension data with a shorter suspension time can be filled in, which effectively prevents the expansion of the data scale, and can avoid affecting the subsequent cluster analysis of neighbor propagation, thereby affecting the prediction results.
[0107] Specifically, in this embodiment, the suspension data is filled with the data of the previous non-suspension trading day. For example, the suspension data is all 0, and the non-suspension data is 6, 6, and 6, then 6, 6, and 6 are used to replace 0.
[0108] Preferably, as image 3 As shown, in the step 3, the specific steps for obtaining the clustering result include:
[0109] Step 3.2: Perform two-norm normalization processing on all the first target feature vectors in all the target feature vector sets to obtain a plurality of first processed feature vectors, and/or, for all the target feature vectors All the second target eigenvectors in the vector set are subjected to two-norm normalization processing to obtain a plurality of second processed eigenvectors;
[0110]The first processing eigenvectors of the xth stock and the yth stock on the tth trading day are respectively:
[0111]
[0112] in, is the first processing eigenvector of the xth stock on the tth trading day, x t_1 is the first target eigenvector of the xth stock on the tth trading day, is the first processing eigenvector of the yth stock on the tth trading day, y t_1 is the first target feature vector of the yth stock on the tth trading day, and T is the total number of trading days;
[0113] The second processing eigenvectors of the xth stock and the yth stock on the tth trading day are respectively:
[0114]
[0115] in, is the second processing eigenvector of the xth stock on the tth trading day, x t_2 is the second target eigenvector of the xth stock on the tth trading day, is the second processing eigenvector of the yth stock on the tth trading day, y t_2 is the second target eigenvector of the yth stock on the tth trading day;
[0116] Step 3.2: Determine the first eigenvector rise and fall difference between the first processing eigenvectors of each of the stocks between two adjacent trading days, and/or, determine the first eigenvector of each of the stocks The difference between the second eigenvector rise and fall of the second processing eigenvector between two adjacent trading days;
[0117] The price differences of the first eigenvectors between the xth stock and the yth stock on the t-1 trading day and the t-th trading day are respectively:
[0118]
[0119] in, is the first processing eigenvector of the xth stock on the t-1 trading day, is the first processing eigenvector of the yth stock on the t-1 trading day, x 1 is the price difference of the first eigenvector between the t-1 trading day and the t-th trading day of the x-th stock, y 1 is the price difference of the first eigenvector between the t-1 trading day and the t-th trading day of the y-th stock;
[0120] The difference between the rise and fall of the second eigenvectors of the x-th stock and the y-th stock on the t-1 trading day and the t-th trading day are respectively:
[0121]
[0122] in, is the second processing eigenvector of the xth stock on the t-1 trading day, is the second processing eigenvector of the yth stock on the t-1 trading day, x 2 is the difference between the rise and fall of the second eigenvector of the x-th stock on the t-1 trading day and the t-th trading day, y 2 is the difference between the rise and fall of the second eigenvector of the y-th stock on the t-1 trading day and the t-th trading day;
[0123] Step 3.3: Use all the first eigenvector up-down difference or all the second eigenvector up-down difference as the input eigenvectors of the neighbor propagation method, and perform neighbor propagation aggregation on all the processing historical transaction data class analysis to obtain the clustering result;
[0124] When all the first eigenvector ups and downs are used as the input eigenvector, the clustering result includes the first similarity between the stocks in a single cluster, the first similarity between the stocks in a single cluster a first average similarity of clusters and a second average similarity of all said clusters;
[0125] The specific formulas for calculating the first similarity, the first average similarity and the second average similarity are respectively:
[0126]
[0127]
[0128]
[0129] Among them, cosθ xy_1 is the first similarity between the xth stock and the yth stock in a single cluster, is the transposition matrix of the first eigenvector rise and fall difference of the xth stock, ||·|| 2 is the Euclidean distance, m is the total number of stocks in the Cth cluster, mean C_1 is the first average similarity of the Cth cluster, w is the total number of the clusters obtained according to the clustering analysis of neighbor propagation, mean whole_1 is the second average similarity;
[0130] When all the second eigenvector ups and downs are used as the input eigenvectors, the clustering result includes the second similarity between the stocks in a single cluster, the second similarity between the stocks in a single cluster a third average similarity of clusters and a fourth average similarity of all said clusters;
[0131] The specific formulas for calculating the second similarity, the third average similarity and the fourth average similarity are respectively:
[0132]
[0133]
[0134]
[0135] Among them, cosθ xy_2 is the second similarity between the xth stock and the yth stock in a single cluster, is the transposition matrix of the difference between the rise and fall of the second eigenvector of the xth stock, mean C_2 is the third average similarity of the Cth cluster, mean whole_2 is the fourth average similarity.
[0136] Performing two-norm normalization on all the first target feature vectors and/or all the second target feature vectors can prevent the differences between the first target feature vectors and/or the second target feature vectors from being too large , thus affecting the results of the subsequent neighbor propagation cluster analysis, thereby affecting the final prediction results; the first eigenvector rise and fall difference is used as the input eigenvector, or all the second processing eigenvectors between adjacent trading days The ups and downs difference, that is, the second eigenvector’s ups and downs difference is used as the input feature vector, so that based on the neighbor propagation method, according to the input feature vector, the neighbor propagation clustering analysis is performed on the processing historical transaction data corresponding to all stocks, and the clustering is obtained result.
[0137] Specifically, in this embodiment, the closing price difference is used as the first eigenvector difference, and the first similarity between two stocks in a corresponding single cluster and the first average similarity of a single cluster are calculated respectively. degree and the second average similarity of all clusters, and the difference between the rise and fall of the trading volume is used as the difference between the rise and fall of the second eigenvector, and the second similarity between the stocks in the corresponding single cluster is calculated, and the second similarity between the stocks in a single cluster is calculated respectively. The third average similarity of the cluster and the fourth average similarity of all the clusters, and finally the result obtained by calculating the difference between the closing price rise and fall is used as the clustering result of this embodiment.
[0138] Preferably, as Figure 4 As shown, in S4, the specific steps of obtaining the stock trend prediction model include:
[0139] S4.1: Use all the first eigenvector up-down differences and/or all the second eigenvector up-down differences corresponding to the preset number of sample stocks as sample labels, and use all the above-mentioned making a data set of all the processing historical transaction data corresponding to the sample label and the preset number of sample stocks;
[0140] S4.2: Obtain a training set and a test set according to the data set;
[0141] S4.3: Based on the support vector machine training method, train the training set to obtain a support vector machine training model, and use the test set to test the support vector machine training model to obtain the stock trend predictive model.
[0142] Preferably, the specific steps of S3.2 include:
[0143] S3.21: Perform normalization processing on the data set to obtain a target data set;
[0144] S3.22: Divide the target data set into a training set and a test set according to a preset division ratio.
[0145] Select a preset number of sample stocks in the clusters of the stocks to be predicted according to the clustering results, and use the corresponding first eigenvector up-down difference and/or all second eigenvector up-down difference as sample labels, It is convenient to ensure that the stock trend prediction model obtained based on the support vector machine training method has high prediction accuracy and high parallelism.
[0146] Specifically, this embodiment analyzes the clustering results calculated in S3 (that is, the similarities calculated by the difference between the closing price rise and fall), and analyzes the corresponding clustering results in one of the clusters, and finds that these stocks are basically They all belong to the securities industry, and nearly 79.8% of the days (1942/2433) in the ten years have roughly the same rise and fall, so it can be considered that the fluctuations between these stocks have a strong correlation.
[0147] Specifically, in this embodiment, 9 stocks in the securities cluster are selected as sample stocks, and a new data set with 18 sample tags is built based on the corresponding closing price difference and trading volume difference.
[0148] Specifically, in this embodiment, the first 80% of the target data set is used as a training set, and the last 20% is used as a test set.
[0149] Preferably, the following steps are also included before S4.3:
[0150] The penalty factor and kernel function in the support vector machine training method are obtained by using a grid search method.
[0151] The kernel function needs to be determined before the support vector machine training, and because there is a certain error in the known data for determining the kernel function, it is necessary to introduce a penalty factor to correct it, so that the stock trend prediction model obtained after training in this embodiment is correct. The prediction and classification of stock ups and downs are more accurate; since each parameter combination in the process of obtaining parameters by the grid search method is independent of each other and does not affect each other, the parallelism is high, so the optimal penalty factor and kernel can be obtained through the grid search method. function, so that the optimal penalty factor and kernel function are used for SVM training, which is convenient to obtain a stock trend prediction model with high prediction and classification accuracy; wherein, the grid search method is an existing technology, and will not be described in detail.
[0152] Specifically, in this embodiment, Pacific Securities (consistent with the ups and downs volatility of the securities cluster) is used as the stock to be predicted, and different time periods are selected, which are respectively 5 days, 10 days and 15 days. The stock trend prediction model based on the neighbor propagation clustering method and the support vector machine training method (AP-SVM) predicts the Pacific Securities in different time periods, and at the same time uses the traditional support vector machine training method (SVM) to predict the stock trend. Pacific Securities in different time periods make predictions, and compare the accuracy of the prediction results obtained by the two methods, as shown in Table 2.
[0153] Table 2 The accuracy of the forecast results of SVM and AP-SVM on Pacific Securities
[0154]
[0155] As can be seen from Table 2, compared with the prediction of stock ups and downs based on the traditional support vector machine training method, in the present embodiment, based on the nearest neighbor propagation clustering method and the support vector machine training method (AP-SVM) obtained The accuracy rate of the stock trend forecasting model for the stock's ups and downs trend prediction has been significantly improved.

Example Embodiment

[0156] Embodiment two, such as Figure 5 As shown, a stock prediction system based on neighbor propagation, including data acquisition module, data processing module, cluster analysis module, model training and construction module and prediction module;
[0157] The data acquisition module is used to acquire a plurality of historical transaction data of a plurality of stocks within a preset time;
[0158] The data processing module is configured to process the set of feature vectors in the historical transaction data of any one of the stocks to obtain a set of target feature vectors corresponding to one of the stocks;
[0159] The clustering analysis module is used to directly obtain the one-to-one correspondence with the other remaining stocks in the data processing module according to the target feature vector set of the corresponding one of the stocks obtained by the data processing module. A plurality of the target feature vector sets; it is also used to perform neighbor propagation clustering analysis on the historical transaction data corresponding to all the stocks according to all the target feature vector sets using the neighbor propagation method to obtain a clustering result;
[0160] The model training and construction module is used to select a preset number of sample stocks in the clusters of the stocks to be predicted according to the clustering results, and based on the support vector machine training method, according to the target feature vector set and the sample stocks The historical transaction data corresponding to the stock is obtained to obtain a stock trend prediction model;
[0161] The prediction module is used for the stock trend prediction model to predict the stock to be predicted and obtain a prediction result.
[0162] The stock prediction system based on neighbor propagation in this embodiment can analyze the target eigenvector set with weak correlation by processing the eigenvector set in the historical transaction data of any stock, so as to obtain the The corresponding target feature vector set, through which one of the corresponding target feature vector sets can directly obtain the one-to-one corresponding target feature vector sets of other stocks; through the target feature vector set corresponding to each stock, the stock can be expressed The relationship between all feature vectors can also reduce the amount of calculation and calculation time, and at the same time, it can also improve the speed of subsequent support vector machine training based on the target feature vector set, occupying a small amount of memory, so as to facilitate the improvement of the entire stock ups and downs trend prediction process. Efficiency; through the nearest neighbor propagation method to carry out the clustering analysis of all stocks, the stocks with a large similarity, that is, the stocks with the same volatility can be clustered in the same cluster, which is convenient for subsequent support based on the clustering results Vector machine training, high parallelism, the obtained stock trend prediction model can accurately predict the ups and downs of the stocks to be predicted, and significantly improve the prediction accuracy; wherein, the stock to be predicted can be any one of multiple stocks The stock may also be a stock of the same type as one of the multiple stocks; wherein, the preset time may be selected according to actual conditions.

Example Embodiment

[0163] Embodiment 3. Based on Embodiment 1 and Embodiment 2, this embodiment also discloses a stock prediction device based on neighbor propagation, which includes a processor, a memory, and is stored in the memory and can run on the processor. A computer program that, when run, implements the figure 1 The specific steps from S1 to S5 are shown.
[0164] By storing the computer program on the memory and running it on the processor, the prediction of the rising and falling trend of the stock of the present invention is realized. Based on the nearest neighbor propagation clustering method and the support vector machine training method, the calculation amount is low and the calculation time is short. It occupies less memory and has high parallelism. The stock trend prediction model obtained can accurately predict the ups and downs of the stocks to be predicted, and significantly improves the prediction accuracy.
[0165] This embodiment also provides a computer storage medium, where at least one instruction is stored on the computer storage medium, and the specific steps of S1 to S5 are implemented when the instruction is executed.
[0166] By executing the computer storage medium that contains at least one instruction, the prediction of the ups and downs of the stock of the present invention is realized. Based on the nearest neighbor propagation clustering method and the support vector machine training method, the calculation amount is low, the calculation time is short, and the memory occupation is small. The parallelism is high, and the obtained stock trend prediction model can accurately predict the rising and falling trends of the stocks to be predicted, and the prediction accuracy rate is obviously improved.
[0167] For the unfinished details of S1 to S5 in this embodiment, see Embodiment 1 and Figure 1 to Figure 4 The content will not be described in detail.

PUM

no PUM

Description & Claims & Application Information

We can also present the details of the Description, Claims and Application information to help users get a comprehensive understanding of the technical details of the patent, such as background art, summary of invention, brief description of drawings, description of embodiments, and other original content. On the other hand, users can also determine the specific scope of protection of the technology through the list of claims; as well as understand the changes in the life cycle of the technology with the presentation of the patent timeline. Login to view more.

Similar technology patents

Speed changer synchronizer synchronous self-adaptation control method and system

ActiveCN108506477Areduce computationUniform results
Owner:吉泰车辆技术(苏州)有限公司

A visual positioning method and an apparatus

InactiveCN103186797ASolve repeated operationsreduce computation
Owner:IND TECH RES INST

Classification and recommendation of technical efficacy words

  • Reduce operation time
  • reduce computation

Non-volatile memory device and method of operating the same

ActiveUS20130088919A1reduce operation time
Owner:SK HYNIX INC

Air conditioner

InactiveUS20080087031A1reduce operation timeless time
Owner:LG ELECTRONICS INC

Maintenance apparatus and method for an air conditioning system of a motor vehicle

InactiveUS20110203675A1reduce operation time
Owner:ECOTECHNICS

Saturated sliding mode variable structure control method for rapidly maneuvering attitudes of satellites

ActiveCN103708044Areduce computationStance maneuver time shortened
Owner:SHANGHAI AEROSPACE CONTROL TECH INST
Why Eureka
Try Eureka