Microseismic Migration Imaging Positioning Method Based on Multiplication of Waveform Cross-correlation Coefficients

A technology of cross-correlation coefficient and positioning method, applied in the fields of seismology, seismic signal processing, instruments, etc., can solve the problems of enhancement, poor seismic data processing effect, low signal-to-noise ratio, etc., to eliminate the influence of positioning accuracy, avoid The effect of microseismic polarity determination and imaging resolution improvement

Inactive Publication Date: 2020-11-27
OCEAN UNIV OF CHINA
View PDF4 Cites 0 Cited by
  • Summary
  • Abstract
  • Description
  • Claims
  • Application Information

AI Technical Summary

Problems solved by technology

However, the brightness function of its imaging is to take the absolute value of the waveform and then superimpose it, which not only enhances the effective signal but also enhances the noise, and the processing effect on seismic data with low signal-to-noise ratio is not good.
SET is a commonly used source location algorithm for surface microseismic monitoring. For seismic records with low signal-to-noise ratio, this method can still locate microseismic events more accurately, but the positioning accuracy is easily affected by the polarity of the first arrival wave.
In view of the defects of the SET positioning method, the influence of the first arrival polarity is eliminated by adding the focal mechanism polarity correction item, and good results have been achieved in practical applications, but the focal mechanism has many inversion parameters, which makes the calculation efficiency low
The source location method based on the cross-correlation method is to use the seismic events of the same source received by different seismic channels to have similar waveforms, while the random noise is independent of each other, which effectively suppresses the influence of noise, but is also affected by the initial The influence of arrival polarity, although the absolute value of the waveform cross-correlation coefficient can be taken and then superimposed, it can not only eliminate the influence of the first arrival polarity, but also not be affected by the station layout method, but taking the absolute value also enhances the influence of noise , the positioning imaging effect is still not ideal

Method used


Image

  • Microseismic Migration Imaging Positioning Method Based on Multiplication of Waveform Cross-correlation Coefficients
  • Microseismic Migration Imaging Positioning Method Based on Multiplication of Waveform Cross-correlation Coefficients
  • Microseismic Migration Imaging Positioning Method Based on Multiplication of Waveform Cross-correlation Coefficients

Examples


example 1

[0047] Example 1: Simulation experiment

[0048] Such as figure 2 As shown, the model area range is 2000m*2000m*4400m; the velocity model consists of 5 horizontal velocity layers, and the velocity values ​​from top to bottom are 1500m / s, 2400m / s, 3000m / s, 4000m / s and 5000m / s s; the depths are 1200m, 2000m, 2400m, 3200m and 4400m; a total of 50 irregularly distributed receiving points are arranged on the ground, assuming that the theoretical microseismic source position coordinates are (950m, 950m, 2725m), and the time of the earthquake is t=0s. image 3 is the synthetic microseismic record computed by convolution, Figure 4 is the microseismic record after adding a certain degree of random noise, from Figure 4 It can be seen that the signal-to-noise ratio of microseismic records is low, and the signal of microseismic events cannot be identified. For the division of underground imaging points, the imaging area range in X and Y directions is set to 500m~1000m, the imaging a...

example 2

[0049] Example 2: Actual data

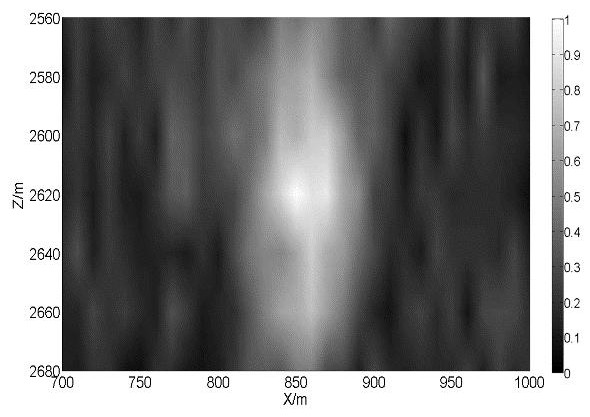
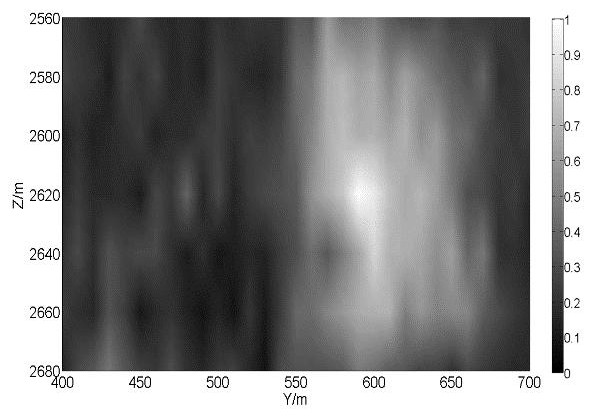
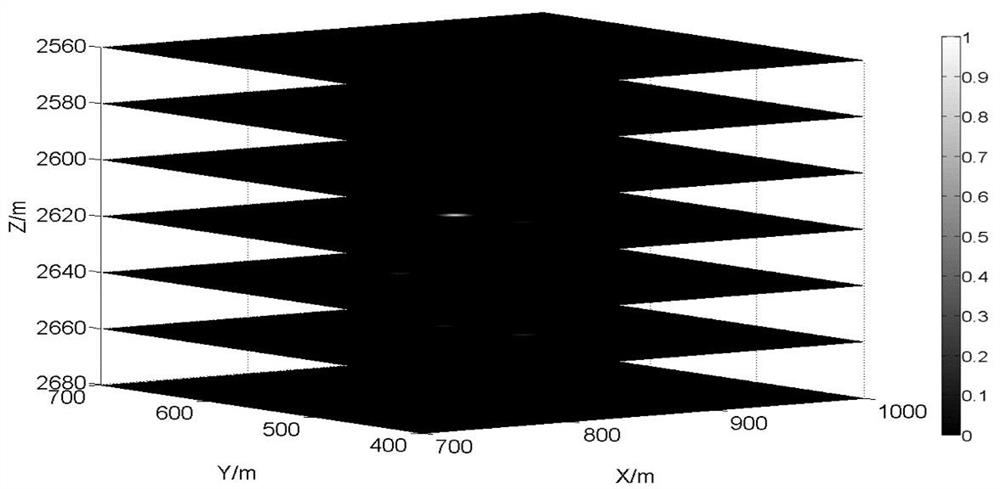
[0050] Figure 9 It is a schematic diagram of the location of ground microseismic monitoring stations in an oil field in a certain area. 27 irregularly distributed stations were used for monitoring, and 18 effective stations were selected for perforation positioning after eliminating invalid stations. Figure 10 It is the first section of perforation signal, and the stations that can identify the perforation signal are the 7th and 13th stations, and the perforation signals received by other stations are submerged by noise, and the signal-to-noise ratio of perforation seismic data lower. Perforation positioning according to the aforementioned process of the present invention: according to the coordinates of the wellhead position and the perforation depth, the imaging area in the X direction is divided into 700m~1000m, the imaging area in the Y direction is 400m~0.70km, and the imaging area in the Z direction It is 2560m~2680m; the intervals of...


PUM


Abstract

The invention relates to a micro-seismic migration imaging positioning method based on multiplication of waveform cross correlation coefficients, and belongs to the technical field of oil-gas reservoir fracture micro-seismic monitoring. The method includes the following steps of: preprocessing actual micro-seismic data; performing subsurface imaging point division, and calculating the travel timeof all imaging points to each receiving point on the ground; for a certain imaging point, eliminating the arrival time difference of the imaging point to different receiving points, calculating the cross-correlation coefficient of a micro-seismic record after the time difference correction; calculating the cross-correlation energy value E of the imaging point; repeating the third and fourth stepsto obtain the energy values E of all underground imaging points; and setting an energy threshold E0, obtaining the imaging point position of an energy maximum value greater than the energy threshold as the occurrence position of a micro-seismic source. The method realizes the dual-effect suppression of the noise by using the form of multiplication of the waveform cross-correlation coefficients soas to greatly improve an anti-noise capability, avoids the interference of the first arrival polarity on the positioning imaging results, has high calculation efficiency and satisfies the real-time monitoring of the micro-seism.

Description

technical field [0001] The invention relates to a microseismic migration imaging positioning method based on multiplication of waveform cross-correlation coefficients, and belongs to the technical field of microseismic monitoring for fracturing of oil and gas reservoirs. Background technique [0002] In the processing of ground microseismic data, the key step is to accurately identify effective microseismic events and accurately locate the identified effective microseismic events, so as to effectively guide hydraulic fracturing and fracture prediction. However, due to the absorption of the underground medium and the interference of ground noise, compared with well monitoring, the signal-to-noise ratio of ground microseismic records is low, making it difficult to identify the seismic phase and pick up the first arrival time, which limits some methods based on seismic phase. The application of the traditional positioning method of identification and time picking makes the micr...

Claims


Application Information

Patent Timeline
Patent Type & Authority Patents(China)
IPC IPC(8): G01V1/28G01V1/30G01V1/36
CPCG01V1/28G01V1/307G01V1/36
Inventor 张建中曾志毅
Owner OCEAN UNIV OF CHINA
Why Eureka
Try Eureka