Visualization algorithm for polar region water vapor transport flux

A technology of water vapor transport and flux, applied in computing, 2D image generation, image data processing, etc., can solve problems such as unclear drawing and drawing errors, and achieve a high degree of freedom, easy operation, and high flexibility. Effect

Active Publication Date: 2020-01-17
INST OF OCEANOLOGY - CHINESE ACAD OF SCI
View PDF6 Cites 3 Cited by
  • Summary
  • Abstract
  • Description
  • Claims
  • Application Information

AI Technical Summary

Problems solved by technology

Therefore, the existing vector drawing methods are prone to the convergence of arrows in polar regions, and often the arrows point outward from the North Pole and the arrows in some areas are reversed, resulting in unclear or even wrong drawings (Figure 3)

Method used


Image

  • Visualization algorithm for polar region water vapor transport flux
  • Visualization algorithm for polar region water vapor transport flux
  • Visualization algorithm for polar region water vapor transport flux

Examples


Embodiment Construction

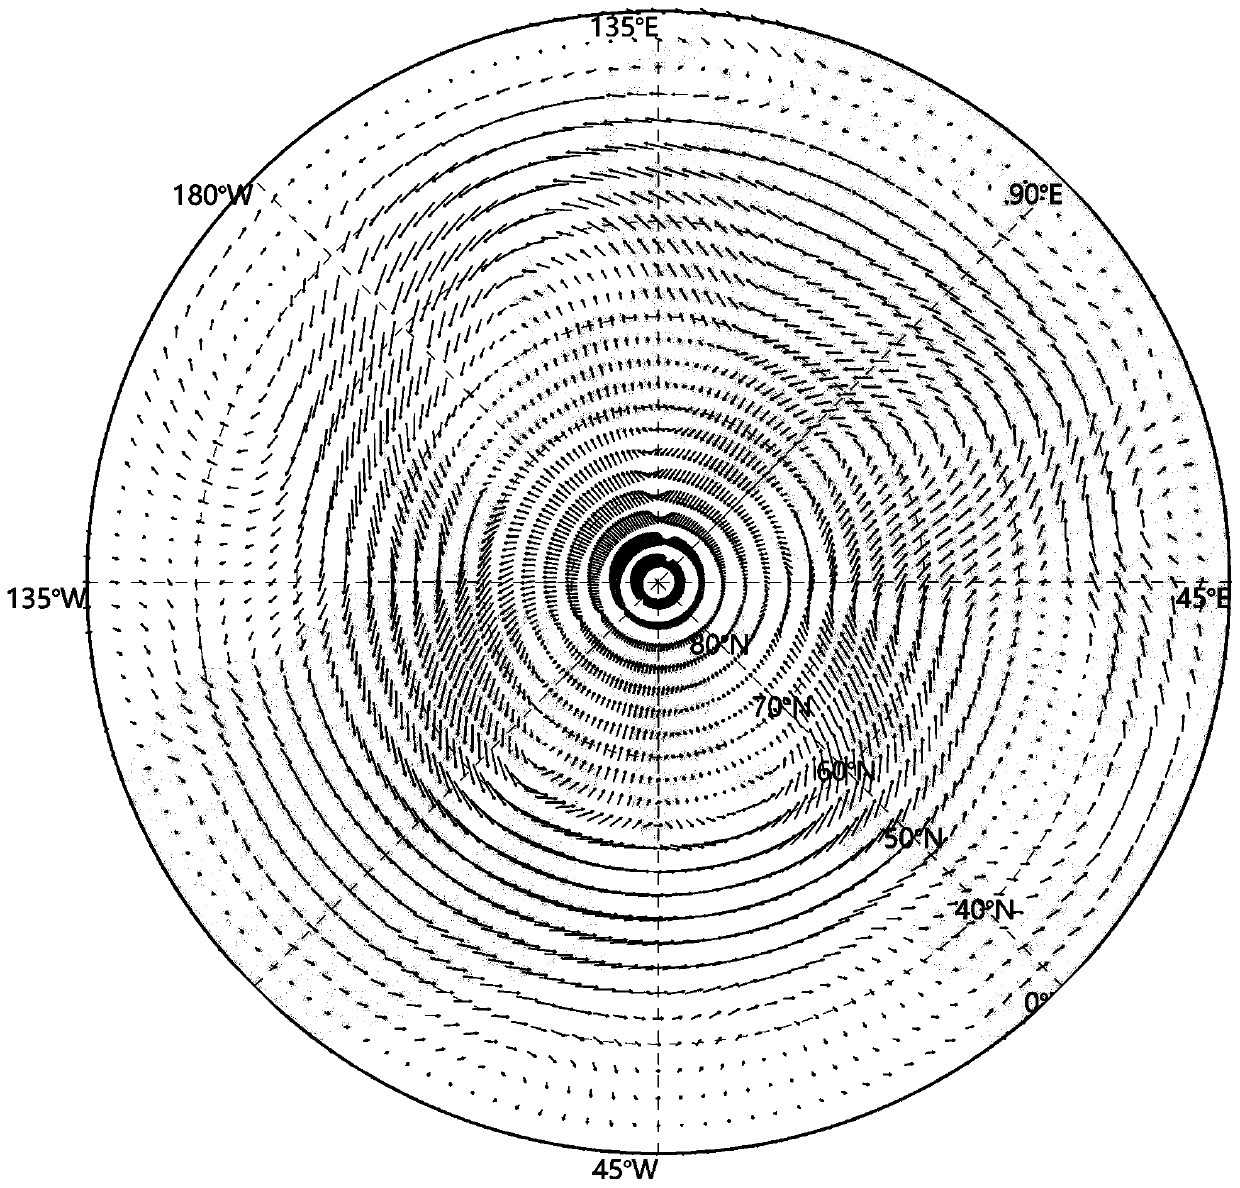
[0031] The present invention will be further described in detail below in conjunction with the examples. The method steps are described with reference to the accompanying drawings. The following implementations take the northern hemisphere as an example to illustrate the purpose of the present invention, but not to limit the scope of the present invention.

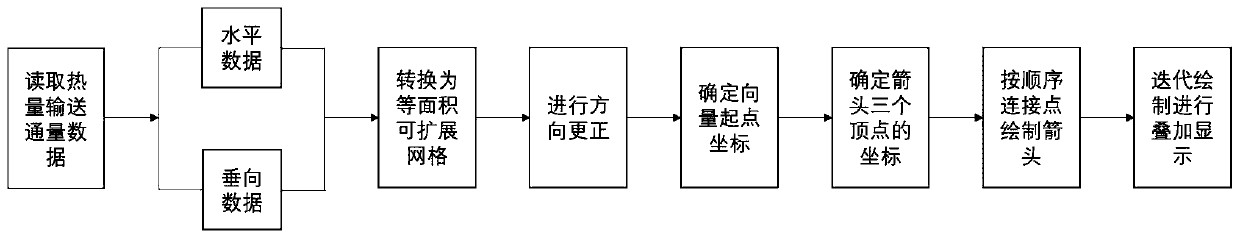
[0032] Such as figure 1 As shown, the program language reads the data of the original global grid, and converts the water vapor transport flux data of the corresponding hemisphere into an equal-area scalable grid with a resolution of 100km×100km (the water vapor transport flux data is a vector of velocity and direction data), to correct the direction of horizontal data and vertical data. To establish an image display window, first determine the coordinates of the starting point of the water vapor transport flux, and then calculate the coordinates of the three vertices of the vector arrow according to the horizontal and ...


PUM


Abstract

The invention relates to a visualization algorithm for a polar region water vapor transport flux vector. The visualization algorithm includes the steps: reading data of an original global grid by using a program language, converting water vapor transmission flux data of a corresponding hemisphere into an EASE (Equal-Area Scale Earth) grid with the resolution of 100km * 100km, and performing direction correction on horizontal data and vertical data; establishing an image display window, determining coordinates of a starting point of water vapor conveying flux firstly, then calculating coordinates of three vertexes of a vector arrow according to the horizontal size and the vertical size of a vector and the angle and the length of the vector arrow, and sequentially connecting the four pointsinto a line to complete drawing of the vector arrow; and carrying out iteration on all grid points, and carrying out superposition display on all water vapor transmission flux vectors to complete alldrawing. According to the visualization algorithm, the problems of convergence and errors of the polar region water vapor transmission flux vectors in the high latitude region are solved, and the accuracy and scientificity are relatively high, and a user can randomly adjust each parameter drawn by the vectors according to requirements, and the operation is simple and convenient, and the visual result is attractive.

Description

technical field [0001] The invention relates to the step of drawing polar water vapor transport flux vectors, in particular to a process algorithm for visualizing polar water vapor transport vectors. Background technique [0002] In the study of climatology and meteorology, the drawing of meteorological vector data is widely used in the research and mapping of polar regions. This visualization algorithm is implemented using the IDL programming language. IDL has powerful functions. However, since the latitude and longitude data corresponding to the grid used for the meteorological vector data in polar regions are often non-uniformly distributed, the existing built-in functions of IDL such as VECTOR, IVECTOR, ARROW, etc. all require the coordinates of the data to be symmetrical, for example, the longitude or latitude of adjacent grids is the same or the difference in latitude and longitude between grids is the same. Therefore, the existing vector drawing methods are prone to ...

Claims


Application Information

Patent Timeline
Patent Type & Authority Applications(China)
IPC IPC(8): G06T11/20
CPCG06T11/206
Inventor 梁钰毕海波王云鹤黄海军
Owner INST OF OCEANOLOGY - CHINESE ACAD OF SCI
Why Eureka
Try Eureka