[0066] In order to understand the characteristics and technical content of the embodiments of the present invention in more detail, the implementation of the embodiments of the present invention will be described in detail below with reference to the accompanying drawings. The attached drawings are for reference and explanation purposes only, and are not used to limit the embodiments of the present invention.
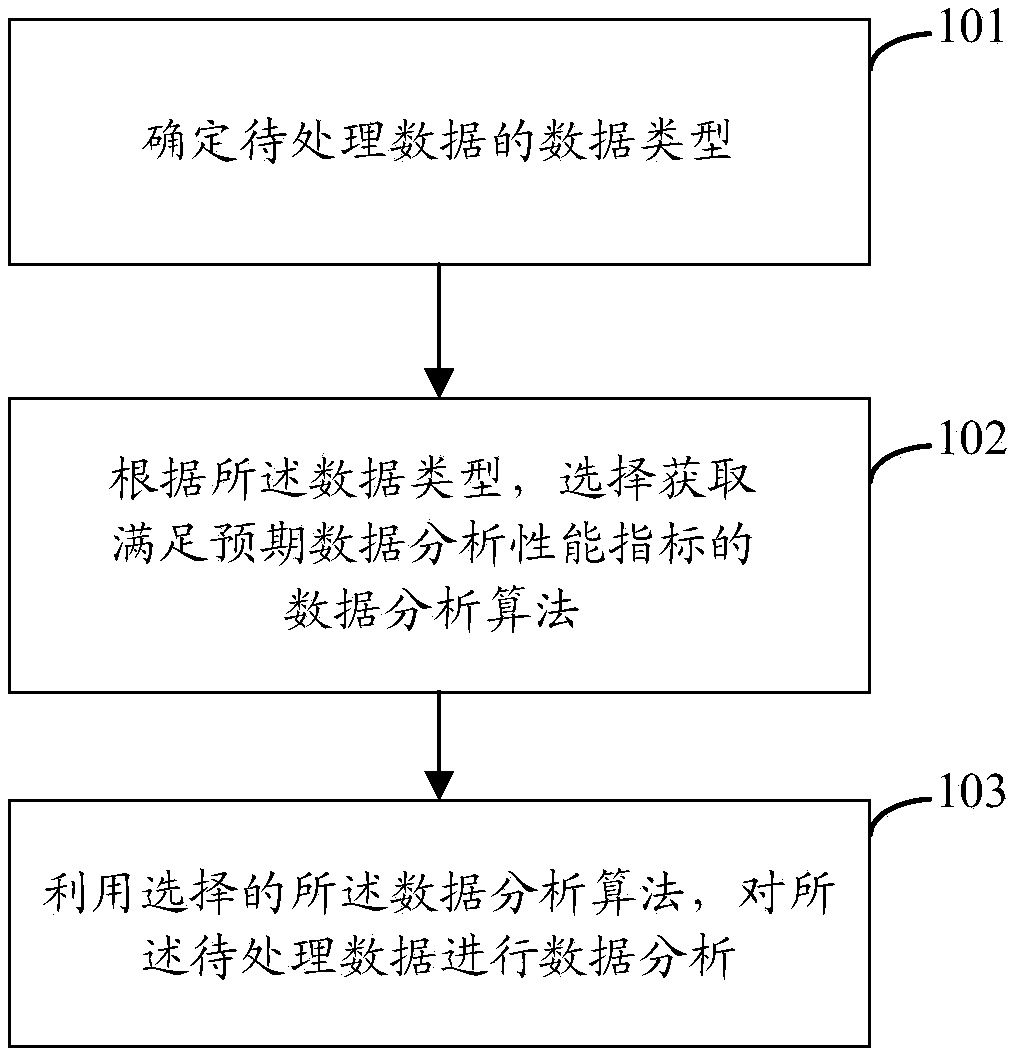
[0067] An embodiment of the present invention is a data processing method, such as figure 1 Shown, including:
[0068] Step 101: Determine the data type of the data to be processed.
[0069] The data to be processed may be time series data. The data type may include periodic data and aperiodic data other than the periodic data.
[0070] Wherein, the period data is data with all data generated in a period as a data analysis unit. For example: monthly communication data of a mobile user, daily system access data of a server device, and hourly video data stored by a video surveillance system.
[0071] In some embodiments, the step 101 includes determining whether the data to be processed is periodic data. Specifically, the method for determining whether the data to be processed is periodic data may be by performing Fourier transform on the data to be processed, and then performing wavelet variance calculation on the data to be processed after Fourier transform, and checking according to the result of the wavelet variance calculation Whether the data to be processed is periodic data.
[0072] Step 102: According to the data type, select and obtain a data analysis algorithm that meets the expected data analysis performance index. The data analysis algorithms that meet the expected data analysis performance indicators here include:
[0073] Using the selected data analysis algorithm to perform the analysis performance of the data analysis of the data of the corresponding data type can achieve the expected performance index value, for example, the accuracy of the data analysis result can reach the expected accuracy; another example is based on the abnormality of the data analysis result The early warning accuracy rate of early warning can reach the expected accuracy rate.
[0074] The step 102 includes but is not limited to at least one of the following:
[0075] If the data to be processed is periodic data, adopt an analog periodic algorithm;
[0076] The period data adopts the analog period algorithm to analyze the similar parameters of the future period based on the reference value of the past period. Compared with other algorithms, the analog periodic algorithm is generally lower in cost, less time-consuming, and more reliable in calculating periodic data.
[0077] If the data to be processed is aperiodic data, it is determined whether the local fluctuation range of the data to be processed reaches the fluctuation range threshold; wherein, the preset threshold can be set according to actual needs.
[0078] If the local fluctuation amplitude of the data to be processed is greater than the preset threshold, adopt a ring average algorithm;
[0079] When the local fluctuation amplitude of aperiodic data is greater than the preset threshold, since the local fluctuation amplitude of the data to be processed is relatively large and lacks periodicity, a more accurate algorithm is required. The chain average method is adopted to analyze the subsequent time series index value by comparing the average value of the time series index value contained in the data to be processed in the previous period of time. Compared with other algorithms, the chain average algorithm is more flexible, and the chain time period can be adjusted as needed to achieve accurate judgment.
[0080] If the local fluctuation amplitude of the data to be processed is not greater than the preset threshold, a threshold mutation algorithm is adopted.
[0081] When the local fluctuation amplitude of the aperiodic data is less than the preset threshold, because the local fluctuation amplitude of the data to be processed is small and lacks periodicity, the threshold mutation algorithm is adopted to save computing resources while judging that the mutation amplitude exceeds the preset threshold. Set threshold data. Compared with other algorithms, the threshold mutation algorithm has lower cost, quick response, and can accurately locate the data whose mutation amplitude exceeds the preset threshold.
[0082] Step 103: Use the selected data analysis algorithm to perform data analysis on the to-be-processed data.
[0083] Among them, the analog cycle algorithm uses the following formula:
[0084]
[0085]
[0086]
[0087] Wherein, the expected value E(t) is the average value of the time series index values contained in the data to be processed, x i Is the time series index value at the i-th time point, 1≤m≤n, t represents time, σ(t) is the standard deviation of the time series index value, and γ(t) is the period of the index sequence in the γ space Analog value, α is the standard deviation confidence rate of the normal distribution of the time series standard value. α can be expressed as a percentage, which is used to indicate the credibility of the normal distribution standard deviation of the time series standard value contained in the data to be processed. In some practical applications, it may be affected by the stability of the equipment and the system. The higher the sex, the closer α is to 100%.
[0088] The chain average algorithm uses the following formula:
[0089]
[0090] Wherein, the expected value E(t) is the average value of the time series index values contained in the data to be processed, t represents time, x i Is the time sequence index value of the i-th time point, 1≤m≤n.
[0091] The threshold mutation algorithm uses the following formula:
[0092]
[0093]
[0094]
[0095] Among them, the expected value E(t m ) And the expected value E(t 2m ) Is the mean value of the time series index values contained in the data to be processed, t represents time, x i Is the time series index value of the i-th time point, 1≤m≤n, x j Is the time series index value at the jth time point, It is a mutation factor.
[0096] In some embodiments,
[0097] when When the time sequence index value rises suddenly; When the time sequence index value drops suddenly; p is the sudden rise threshold, and q is the sudden drop threshold.
[0098] An embodiment of the present invention is a data processing device 21, the composition structure of the device is as follows figure 2 As shown, it includes: a data analysis module 201, an algorithm acquisition module 202, and a data analysis module 203; among them,
[0099] The data classification module 201 is used to determine the data type of the data to be processed.
[0100] In some embodiments, the data classification module 201 is further configured to determine whether the data to be processed is periodic data; wherein, the periodic data is data generated with a preset duration as a period.
[0101] The algorithm acquisition module 202 is configured to select and acquire a data analysis algorithm that meets the expected data analysis performance index according to the data type;
[0102] In some embodiments, the algorithm acquisition module 202 is further configured to: if the data to be processed is periodic data, adopt an analog periodic algorithm. Among them, the analog cycle algorithm adopts the following formula:
[0103]
[0104]
[0105]
[0106] Wherein, the expected value E(t) is the average value of the time series index values contained in the data to be processed, x i Is the time series index value at the i-th time point, 1≤m≤n, t represents time, σ(t) is the standard deviation of the time series index value, and γ(t) is the periodic analog value of the index sequence in the γ space , Α is the confidence rate of the normal distribution standard deviation of the time series index value.
[0107] In some embodiments, the algorithm acquisition module 202 is also used for:
[0108] If the data to be processed is aperiodic data, it is determined whether the local fluctuation range of the data to be processed reaches the fluctuation range threshold.
[0109] If the local fluctuation amplitude of the data to be processed is greater than the fluctuation amplitude threshold, the chain average algorithm is adopted; wherein, the chain average algorithm adopts the following formula:
[0110]
[0111] Wherein, the expected value E(t) is the average value of the time series index values contained in the data to be processed, t represents time, x i Is the time sequence index value of the i-th time point, 1≤m≤n.
[0112] If the local fluctuation amplitude of the data to be processed is not greater than the fluctuation amplitude threshold, a threshold mutation algorithm is adopted; wherein, the threshold mutation algorithm uses the following formula:
[0113]
[0114]
[0115]
[0116] Among them, the expected value E(t m ) And the expected value E(t 2m ) Is the mean value of the time series index values contained in the data to be processed, t represents time, x i Is the time series index value of the i-th time point, 1≤m≤n, x j Is the time series index value at the jth time point, It is a mutation factor.
[0117] In some embodiments,
[0118] when When the time sequence index value rises suddenly; When the time sequence index value drops suddenly; p is the sudden rise threshold, and q is the sudden drop threshold.
[0119] The data analysis module 203 is configured to use the selected data analysis algorithm to perform data analysis on the data to be processed.
[0120] According to a data processing method of a specific embodiment of the present invention, the method flow is as follows image 3 Shown, including:
[0121] Obtain basic data from a data source, and determine whether data preprocessing 301 is required according to the law of the basic data collection frequency. The average data of adjacent moments can be used for smoothing processing.
[0122] The data to be processed is obtained through data preprocessing 301; the determination of whether the data to be processed is periodic data 302, wherein the determination of whether the data is periodic data 302 can be achieved by Fourier transform of the data to be processed and wavelet variance The calculation method checks whether the data is periodic data.
[0123] If it is periodic data, the analog periodic algorithm 303 is used.
[0124] If it is aperiodic data, it is determined whether the local fluctuation amplitude of the data to be processed is greater than the fluctuation amplitude threshold 304. Wherein, the fluctuation amplitude threshold can be set according to actual needs.
[0125] If the local fluctuation amplitude of the data to be processed is greater than the fluctuation amplitude threshold, the chain average algorithm 305 is adopted.
[0126] If the local fluctuation amplitude of the data to be processed is not greater than the fluctuation amplitude threshold, the threshold mutation algorithm 306 is adopted.
[0127] Wherein, the analog cycle algorithm 303 adopts the following formula:
[0128]
[0129]
[0130]
[0131] Wherein, the expected value E(t) is the mean value of the time series index values contained in the data to be processed, x i Is the time series index value of the i-th time point, 1≤m≤n, t represents time, σ(t) is the standard deviation of the time series index value, and γ(t) is the periodic analog value of the index sequence in the γ space , Α is the confidence rate of the normal distribution standard deviation of the time series index value.
[0132] In a specific embodiment of the analog period algorithm 303, let the index x n (t 1 ),x n-1 (t 2 ),...,x n-m+1 (t m )(1≤m≤n) is the time series index value generated by the big data cluster system in any period of time, where the time series time is 0 1 2 m , Calculate x n (t 1 ),x n-1 (t 2 ),...,x n-m+1 (t m )(1≤m≤n) expected value E(t), set as the critical threshold of the time series index value; calculate the deviation value of each time series index value from the expected value E(t), namely x i -E(t); calculate the mean value of the square of the deviation of the time series index value, that is, the variance The square root is σ(t).
[0133] Calculate the index sequence period analog value γ(t) in the γ space with a 99% confidence rate of the normal distribution standard deviation of the time series index value, and compare it with the set threshold E(t), and exceed the threshold range as an abnormal value. Such as Figure 4 The time series data diagram analyzed by the analog cycle algorithm is mapped to Figure 5 Mark the threshold line γ(t)=-1, and get γ(t)≤-1 as the periodic abnormal interval value.
[0134] The chain average algorithm 305 uses the following formula:
[0135]
[0136] Wherein, the expected value E(t) is the average value of the time series index values contained in the data to be processed, t represents time, x i Is the time sequence index value of the i-th time point, 1≤m≤n.
[0137] In a specific embodiment of the chain average algorithm 305, the comparison between the fluctuation of the time series index value of a certain big data cluster and the horizontal line mark threshold value s is as follows: Image 6 Shown:
[0138] Set index x n (t 1 ),x n-1 (t 2 ),...,x n-m+1 (t m )(1≤m≤n) is the time series index value generated by the big data cluster system for a period of time, where the time series time is 0 1 2 m , Calculate x n (t 1 ),x n-1 (t 2 ),...,x n-m+1 (t m )(1≤m≤n), the expected value E(t) is set as the critical threshold s of the hourly index. If the index exceeds this threshold, the abnormal index sequence will be abnormal. This time is the abnormal point to be optimized. In production practice, the production It is a good practice to flexibly configure the value of s.
[0139] The threshold mutation algorithm 306 uses the following formula:
[0140]
[0141]
[0142]
[0143] Among them, the expected value E(t m ) And expected value E(t 2m ) Is the mean value of the time series index values contained in the data to be processed, t represents time, x i Is the time series index value of the i-th time point, 1≤m≤n, x j Is the time series index value at the jth time point, It is a mutation factor.
[0144] In some embodiments,
[0145] when When the time sequence index value rises suddenly; When the time sequence index value drops suddenly; p is the sudden rise threshold, and q is the sudden drop threshold.
[0146] In a specific embodiment of the threshold mutation algorithm 306, let x n (t 1 ),x n-1 (t 2 ),...,x n-m+1 (t m )(1≤m≤n), x n-m (t m+1 ),x n-m-1 (t m+2 ),...,x n-2m+1 (t 2m ) (1≤m≤n) is the two consecutive time series index values on a certain time series index value R space of the big data cluster. Calculate x n (t 1 ),x n-1 (t 2 ),...,x n-m+1 (t m )(1≤m≤n) expected value E(t m ), calculate x n-m (t m+1 ),x n-m-1 (t m+2 ),...,x n-2m+1 (t 2m )(1≤m≤n) Expected value E(t 2m ), find the expectation E(t m ) And expectation E(t 2m ) Ratio If The timing index value rises suddenly, if The timing index value drops suddenly.
[0147] Such as Figure 7 As shown, if the sudden rise threshold p=2 is set, the expected E(t 2m ) Is E(t m ), that is, if the expected sudden increase of the index is more than twice, it is the sudden increase of the index; if the sudden drop threshold q=0.5, then the expected index value sequence E(t 2m ) Is E(t m ) 1/2 times, that is, the expected sudden drop of less than 1/2 times is the sudden drop of the index. The sudden rise threshold p and the sudden drop threshold q here are thresholds for judging the magnitude of the sudden change, which can be obtained by the algorithm training, or the width of the threshold can be set by the operation and maintenance personnel.
[0148] An embodiment of the present invention, a basic index matrix for big data cluster optimization, includes:
[0149] The basic index matrix is divided into the index matrix corresponding to the application (Applications), the index matrix corresponding to the memory (Memory), the index matrix corresponding to the thread and the remote procedure call (RPC, Remote Procedure Call) call, a total of three groups, depicting the entire cluster Statistical information and operating conditions are used for tuning, monitoring, and fault diagnosis. The basic index matrix proposed by the present invention depicts the big data cluster portrait, summarizes the fixed-line operation and maintenance experience of Heilongjiang Mobile’s core important indicators in the production and operation of the big data cluster, and combines the chain average algorithm and threshold mutation of the data processing method proposed by the present invention Machine learning algorithms such as algorithms and analog cycle algorithms lay the foundation for intelligent operation and maintenance of big data clusters.
[0150] (1) Application indicators
[0151] name description Vcores Available Vcores size allocatedVCores Number of Vcores allocated to the queue allocatedMB Queue allocation content MB size allocatedContainers Number of containers allocated in the queue
[0152] Table 1
[0153] The key indicators of the health of big data cluster operations include VCores virtual central processing unit (CPU, Central Processing Unit) cores, virtual CPU cores allocated by the queue, queue memory size and the number of allocated containers (Containers). Such indicators can be accurate for big data clusters. The job behavior is described in a portrait, and the sequential data of the index is effectively analyzed in combination with the data processing method proposed by the present invention.
[0154] (2) Memory indicators
[0155]
[0156]
[0157] Table 2
[0158] The measurement of cluster indicator heap memory and Java GC directly affects the speed of reading and writing files of the cluster, and is closely related to the query and storage of HBase, Hive, and Impala on the upper layer of the cluster. The business operation support system (BOSS, Business&Operation Support System) of Heilongjiang Mobile Due to the heap memory and GC parameter settings at the fee and accounting big data cluster layer, users can query the cloud detailed bills and bills faster.
[0159] (3) Number of threads and RPC call indicators
[0160]
[0161]
[0162] table 3
[0163] The status of the number of threads has an impact on both the cluster server and the client. An increase or decrease in the number of threads will cause an increase in cluster load pressure or insufficient processing performance. It can be deployed through a comprehensive analysis of the running, blocking, waiting, and termination of the number of threads The bearing pressure of the nodes makes the cluster load balance; RPC calls are widely used in the big data cluster environment, which is the basis for the communication calls between the cluster and the client and the internal components of the cluster. The application client, management node, data node, distributed file system Whether the interaction state can be optimized, the portrait can be completed through a set of RPC indicators.
[0164] A specific embodiment of the present invention includes:
[0165] (1) Sampling of cluster historical indicator data
[0166] Extract the index sequence data of Applications VCores in the 2018-03-07T09:00:00 index matrix of the Heilongjiang Mobile Business System Big Data Cluster as an example. The sample space takes the number of samples in 10 minutes, that is, from 2018-03-07T09:00:00 to 2018-03-07T10:00:00. The continuous historical sample data is shown in Table 4.
[0167] Time VCores 2018-03-07T09:01:00 85 2018-03-07T09:02:00 25 2018-03-07T09:03:00 91 2018-03-07T09:04:00 78 2018-03-07T09:05:00 63 2018-03-07T09:06:00 28 2018-03-07T09:07:00 22 2018-03-07T09:08:00 X=(22+32)/2 2018-03-07T09:09:00 32 2018-03-07T09:10:00 50
[0168] Table 4
[0169] VCores indicator time series data such as Figure 8 Shown.
[0170] (2) Data preprocessing
[0171] If the regular frequency time series data is taken, there is no need to smoothly preprocess the data. Such as Figure 8 Indicates that there is no VCores data at 2018-03-07T09:08:00, you need to take the VCores indicators at 2018-03-07T09:07:00 and 2018-03-07T09:09:00 for averaging processing, 2018-03-07T09 At 08:00, the VCores index value is 27 after data preprocessing.
[0172] (3) Calculation process
[0173] According to the wavelet variance calculation to obtain aperiodic data and the local fluctuation range is greater than the global fluctuation range, the threshold mutation algorithm is adopted, and p=2, q=0.5. According to the historical index sequence values:
[0174] x 10 (t 1 )=85,x 9 (t 2 )=25,x 8 (t 3 )=91,x 7 (t 4 )=78,x 6 (t 5 )=67
[0175] x 5 (t 6 )=28,x 4 (t 7 )=22,x 3 (t 8 )=29,x 2 (t 9 )=32,x 1 (t 10 )=50
[0176]
[0177]
[0178]
[0179] can be seen Greater than the sudden drop threshold p, the indicator has a sudden drop trend. At this time, the state is an important focus of big data cluster optimization and provides us with optimization diagnostic information: that is, to identify the completion of system subtasks, system load reduction, or system IO, network, memory VCores are not fully utilized due to busy disks. The technical solutions of the chain average algorithm and the analog cycle algorithm are described in detail in the previous section, and will not be repeated here.
[0180] In order to implement the data processing method of the embodiment of the present invention, the embodiment of the present invention also provides a data processing device based on hardware, such as Picture 9 As shown, the data processing device 91 includes: a processor 901 and a memory 902 for storing a computer program that can run on the processor, where:
[0181] When the processor 901 is used to run the computer program, execute:
[0182] Determine the data type of the data to be processed;
[0183] According to the data type, select and obtain a data analysis algorithm that meets the expected data analysis performance index;
[0184] Perform data analysis on the data to be processed using the selected data analysis algorithm.
[0185] In some embodiments, the processor 901 is further configured to execute the following when running the computer program:
[0186] It is determined whether the data to be processed is periodic data; wherein, the periodic data is data generated with a preset duration as a period.
[0187] If the data to be processed is periodic data, an analog periodic algorithm is adopted; wherein, the analog periodic algorithm adopts the following formula:
[0188]
[0189]
[0190]
[0191] Wherein, the expected value E(t) is the mean value of the time series index values contained in the data to be processed, x i Is the time series index value of the i-th time point, 1≤m≤n, t represents time, σ(t) is the standard deviation of the time series index value, and γ(t) is the periodic analog value of the index sequence in the γ space , Α is the confidence rate of the normal distribution standard deviation of the time series index value.
[0192] In some embodiments, the processor 901 is further configured to execute the following when running the computer program:
[0193] If the data to be processed is aperiodic data, it is determined whether the local fluctuation amplitude of the data to be processed reaches a preset threshold.
[0194] If the local fluctuation amplitude of the data to be processed is greater than the preset threshold, the chain average algorithm is adopted; wherein, the chain average algorithm adopts the following formula:
[0195]
[0196] Wherein, the expected value E(t) is the average value of the time series index values contained in the data to be processed, t represents time, x i Is the time sequence index value of the i-th time point, 1≤m≤n.
[0197] If the local fluctuation amplitude of the data to be processed is not greater than the preset threshold, adopt a threshold mutation algorithm; wherein, the threshold mutation algorithm uses the following formula:
[0198]
[0199]
[0200]
[0201] Among them, the expected value E(t m ) And expected value E(t 2m ) Is the mean value of the time series index values contained in the data to be processed, t represents time, x i Is the time series index value of the i-th time point, 1≤m≤n, x j Is the time series index value at the jth time point, It is a mutation factor.
[0202] In some embodiments,
[0203] when When the time sequence index value rises suddenly; When the time sequence index value drops suddenly; p is the sudden rise threshold, and q is the sudden drop threshold.
[0204] The information push control device provided in the foregoing embodiment and the information push control method embodiment belong to the same concept. For the specific implementation process, please refer to the method embodiment, which will not be repeated here.
[0205] Of course, in practical applications, such as Picture 9 As shown, the data processing apparatus may further include at least one communication interface 903. The various components in the data processing device are coupled together through the bus system 904. It can be understood that the bus system 904 is used to implement connection and communication between these components. In addition to the data bus, the bus system 904 also includes a power bus, a control bus, and a status signal bus. But for the sake of clarity, in Picture 9 Various buses are marked as the bus system 904 in this article.
[0206] Among them, the communication interface 903 is used to interact with other devices.
[0207] Specifically, the processor 901 may send an operation result query request to the application server corresponding to the callee application through the communication interface 903, to obtain the operation result of the callee application sent by the application server.
[0208] It can be understood that the memory 902 may be a volatile memory or a non-volatile memory, and may also include both volatile and non-volatile memory. Among them, the non-volatile memory can be a read-only memory (ROM, Read Only Memory), a programmable read-only memory (PROM, Programmable Read-Only Memory), and an erasable programmable read-only memory (EPROM, Erasable Programmable Read-Only Memory). Only Memory), Electrically Erasable Programmable Read-Only Memory (EEPROM, Electrically Erasable Programmable Read-Only Memory), Magnetic Random Access Memory (FRAM, ferromagnetic random access memory), Flash Memory, Magnetic Surface Memory , CD-ROM, or CD-ROM (Compact Disc Read-Only Memory); magnetic surface memory can be disk storage or tape storage. The volatile memory may be a random access memory (RAM, Random Access Memory), which is used as an external cache. By way of exemplary but not restrictive description, many forms of RAM are available, such as static random access memory (SRAM, Static Random Access Memory), synchronous static random access memory (SSRAM, Synchronous Static Random Access Memory), and dynamic random access memory. Memory (DRAM, Dynamic Random Access Memory), Synchronous Dynamic Random Access Memory (SDRAM, Synchronous Dynamic Random Access Memory), Double Data Rate Synchronous Dynamic Random Access Memory (DDRSDRAM, Double Data Rate Synchronous Dynamic Random Access Memory), enhanced Enhanced Synchronous Dynamic Random Access Memory (ESDRAM), SyncLink Dynamic Random Access Memory (SLDRAM), Direct Rambus Random Access Memory (DRRAM) . The memory 902 described in the embodiment of the present invention is intended to include, but is not limited to, these and any other suitable types of memory.
[0209] In the embodiment of the present invention, a computer-readable storage medium is also provided, which is used to store the calculation program provided in the foregoing embodiment to complete the steps of the foregoing method. The computer-readable storage medium can be FRAM, ROM, PROM, EPROM, EEPROM, Flash Memory, magnetic surface memory, optical disc, or CD-ROM, etc.; it can also be a variety of devices including one or any combination of the foregoing memories, such as Mobile phones, computers, smart home appliances, servers, etc.
[0210] The technical advantages of the present invention are mainly manifested in the following aspects:
[0211] (1) The present invention can reduce operation and maintenance costs, and improve the optimization and diagnosis efficiency of multiple nodes and multiple components. Facing the trend of linear growth of large-scale big data cluster nodes, and there are as many as dozens of components in big data clusters, it is difficult to locate fault points in isolated analysis. The method proposed by the present invention can compare basic operation and maintenance indicators through machine learning related algorithms. Obtain comprehensive monitoring and get rid of the dilemma of manually logging in to nodes one by one to confirm cluster log status.
[0212] (2) The chain average algorithm, the threshold mutation algorithm, and the analog cycle algorithm proposed in the present invention can automatically learn and implement refined management cluster basic indicators. The proposed basic index matrix combined with algorithms in various scenarios can describe the fluctuations and cycles of cluster system operation It can get rid of the high false alarm rate by simply defining thresholds.
[0213] (3) The present invention solves the current situation of low accuracy of static data decision-making and no trend analysis. The big data cluster optimization analysis method proposed in this proposal dynamically describes the changes in the pressure of the big data clusters and the periodic changes in different time windows. According to the dynamic change law and trend of the data, the data is in-depth mining and analysis to analyze whether there are sudden abnormalities in the index time series data. .
[0214] (4) The basic index matrix of big data clusters proposed in the present invention can standardize the classification of health indicators, and combine the unified algorithm decision tree to monitor and manage the operation index system in an all-round way. The fixed-line Heilongjiang province big data cluster operation and maintenance experience shows the system The health profile enhances the overall control of the cluster operation status.
[0215] In summary, the present invention realizes rapid fault location of big data clusters, effectively reduces costs, and assists in optimized decision-making through analysis and mining of operation and maintenance data, guarantees stable operation of the system, liberates human resources, and invests in more advanced technical research and production systems Management work.
[0216] It should be noted that the technical solutions described in the embodiments of the present invention can be combined arbitrarily without conflict.
[0217] The above are only the preferred embodiments of the present invention, and are not used to limit the protection scope of the present invention.