Methods of automated spectral peak detection and quantification having learning mode

a technology of spectral peak detection and learning mode, applied in chemical methods analysis, signal recognition, instruments, etc., can solve the problems of mass spectrometry techniques, novice or untrained operators will very likely get an incorrect result or no result at all, and achieve the effect of convenient handling

Inactive Publication Date: 2013-04-23
THERMO FINNIGAN
View PDF11 Cites 34 Cited by
  • Summary
  • Abstract
  • Description
  • Claims
  • Application Information

AI Technical Summary

Benefits of technology

[0010]Embodiments in accordance with the present invention provide methods and computer program products for identifying peaks in spectral data that do not require parameter input or intervention by users or instrument operators. Methods in accordance with the present invention do not make a priori assumptions about the particular line shape of the chromatographic or spectroscopic peak(s) and may fit any individual peak to either a Gaussian, exponentially modified Gaussian, Gamma distribution or other form of shape. By not exposing any adjustable parameters to users, methods in accordance with the invention avoid the problems discussed above, and lend themselves to automated analysis. Further, methods in accordance with the invention avoid all the aforementioned problems associated with peak area integration in prior art automated analyses, since the peak area is known from the peak fitting parameters. The present methods may add together multiple Gaussian shapes to yield a final (complex) peak shape or can cleanly separate overlapping peaks that come from different components. Thus, overlapped peaks are easily handled and the integrals computed from the Gaussian (or other) widths and intensities.
[0012]The learning mode steps allow users to make minor changes in parameterless peak detection in a visual, interactive way. These changes are minor in that they are small changes to the various exit conditions that are already present in the PPD code. Prior to first entry into learning mode, these exit conditions are pre-set based on typical data stream and peak conditions. In order to detect almost all peaks with excellent accuracy, the pre-set exit conditions may permit some small percentage of peaks to be represented with less than optimal parameters. However, the learning mode allows users to fine tune or adapt the procedure to the peculiarities or requirements of any particular experimental data.
[0032]The steps comprising methods in accordance with the instant invention, as outlined above may be grouped into several basic stages of data processing, each stage possibly comprising several steps. The basic stages referred to above comprise: preprocessing to remove baseline and estimate the noise level; formation of an initial estimate of peak parameters; optional subsequent refinement of these estimates, reporting of results, receiving input from a user in a “learning mode” so as to improve accuracy and precision in subsequent execution of the method and repetition of one or more of the above steps using the same or different data and the user preference information obtained in learning mode. Embodiments in accordance with the invention may include, in the second stage, an algorithm in which the most intense peaks remaining in the observed or processed spectrum are subtracted from the spectrum, one by one, until the residual spectrum contains only noisy fluctuations in the intensities. The detection of peaks in spectra may be performed by a matched filter score that assesses the overlap between a canonical peak shape and a window of intensity samples in the chromatogram. The simplest instance of such a filter score is the value of a single sample intensity. A peak is judged to be present when the filter score exceeds a threshold, defined as a multiple of the estimated noise level. Within certain embodiments, the optional final stage of the algorithm refines the initial parameter estimates for multiple detected chromatographic peaks. Refinement consists of exploring the space of N parameters (the total number of parameters across all peaks, i.e. 4 for each Gamma / EMG and 3 for each Gaussian) to find the set of values that minimizes the sum of squared differences between the observed and model chromatogram.

Problems solved by technology

Still further, mass spectrometry techniques may produce complex spectra consisting of several detected peaks, each such peak representing detection of an ion of a particular mass unit.
Existing methods of peak detection have many adjustable parameters, requiring operator skill and patience in arriving at an acceptable result.
Novice or untrained operators will very likely get an incorrect result or no result at all.
This typically results in a very time-consuming process, and the “tweaking” by or inexperience of the user often results in data that is not reproducible and suspect.
Further, such traditional forms of peak identification are not suitable for high-throughput industrial process monitoring or clinical or other chemical screening operations, in which there may be a requirement to analyze many hundreds or even thousands of samples per day.
Also, such prior numerical integration methods handle overlapped peaks poorly, if at all.
However, in some small percentage of cases, PPD may fail to identify a small peak, or may identify peaks that the user considers to be noise, or may arrive at a peak area that the user considers wrong.
In these cases, since there is no way to adjust the PPD process, the user may have to revert to one of the peak detection methods that have adjustable parameters.

Method used


Image

  • Methods of automated spectral peak detection and quantification having learning mode
  • Methods of automated spectral peak detection and quantification having learning mode
  • Methods of automated spectral peak detection and quantification having learning mode

Examples


Embodiment Construction

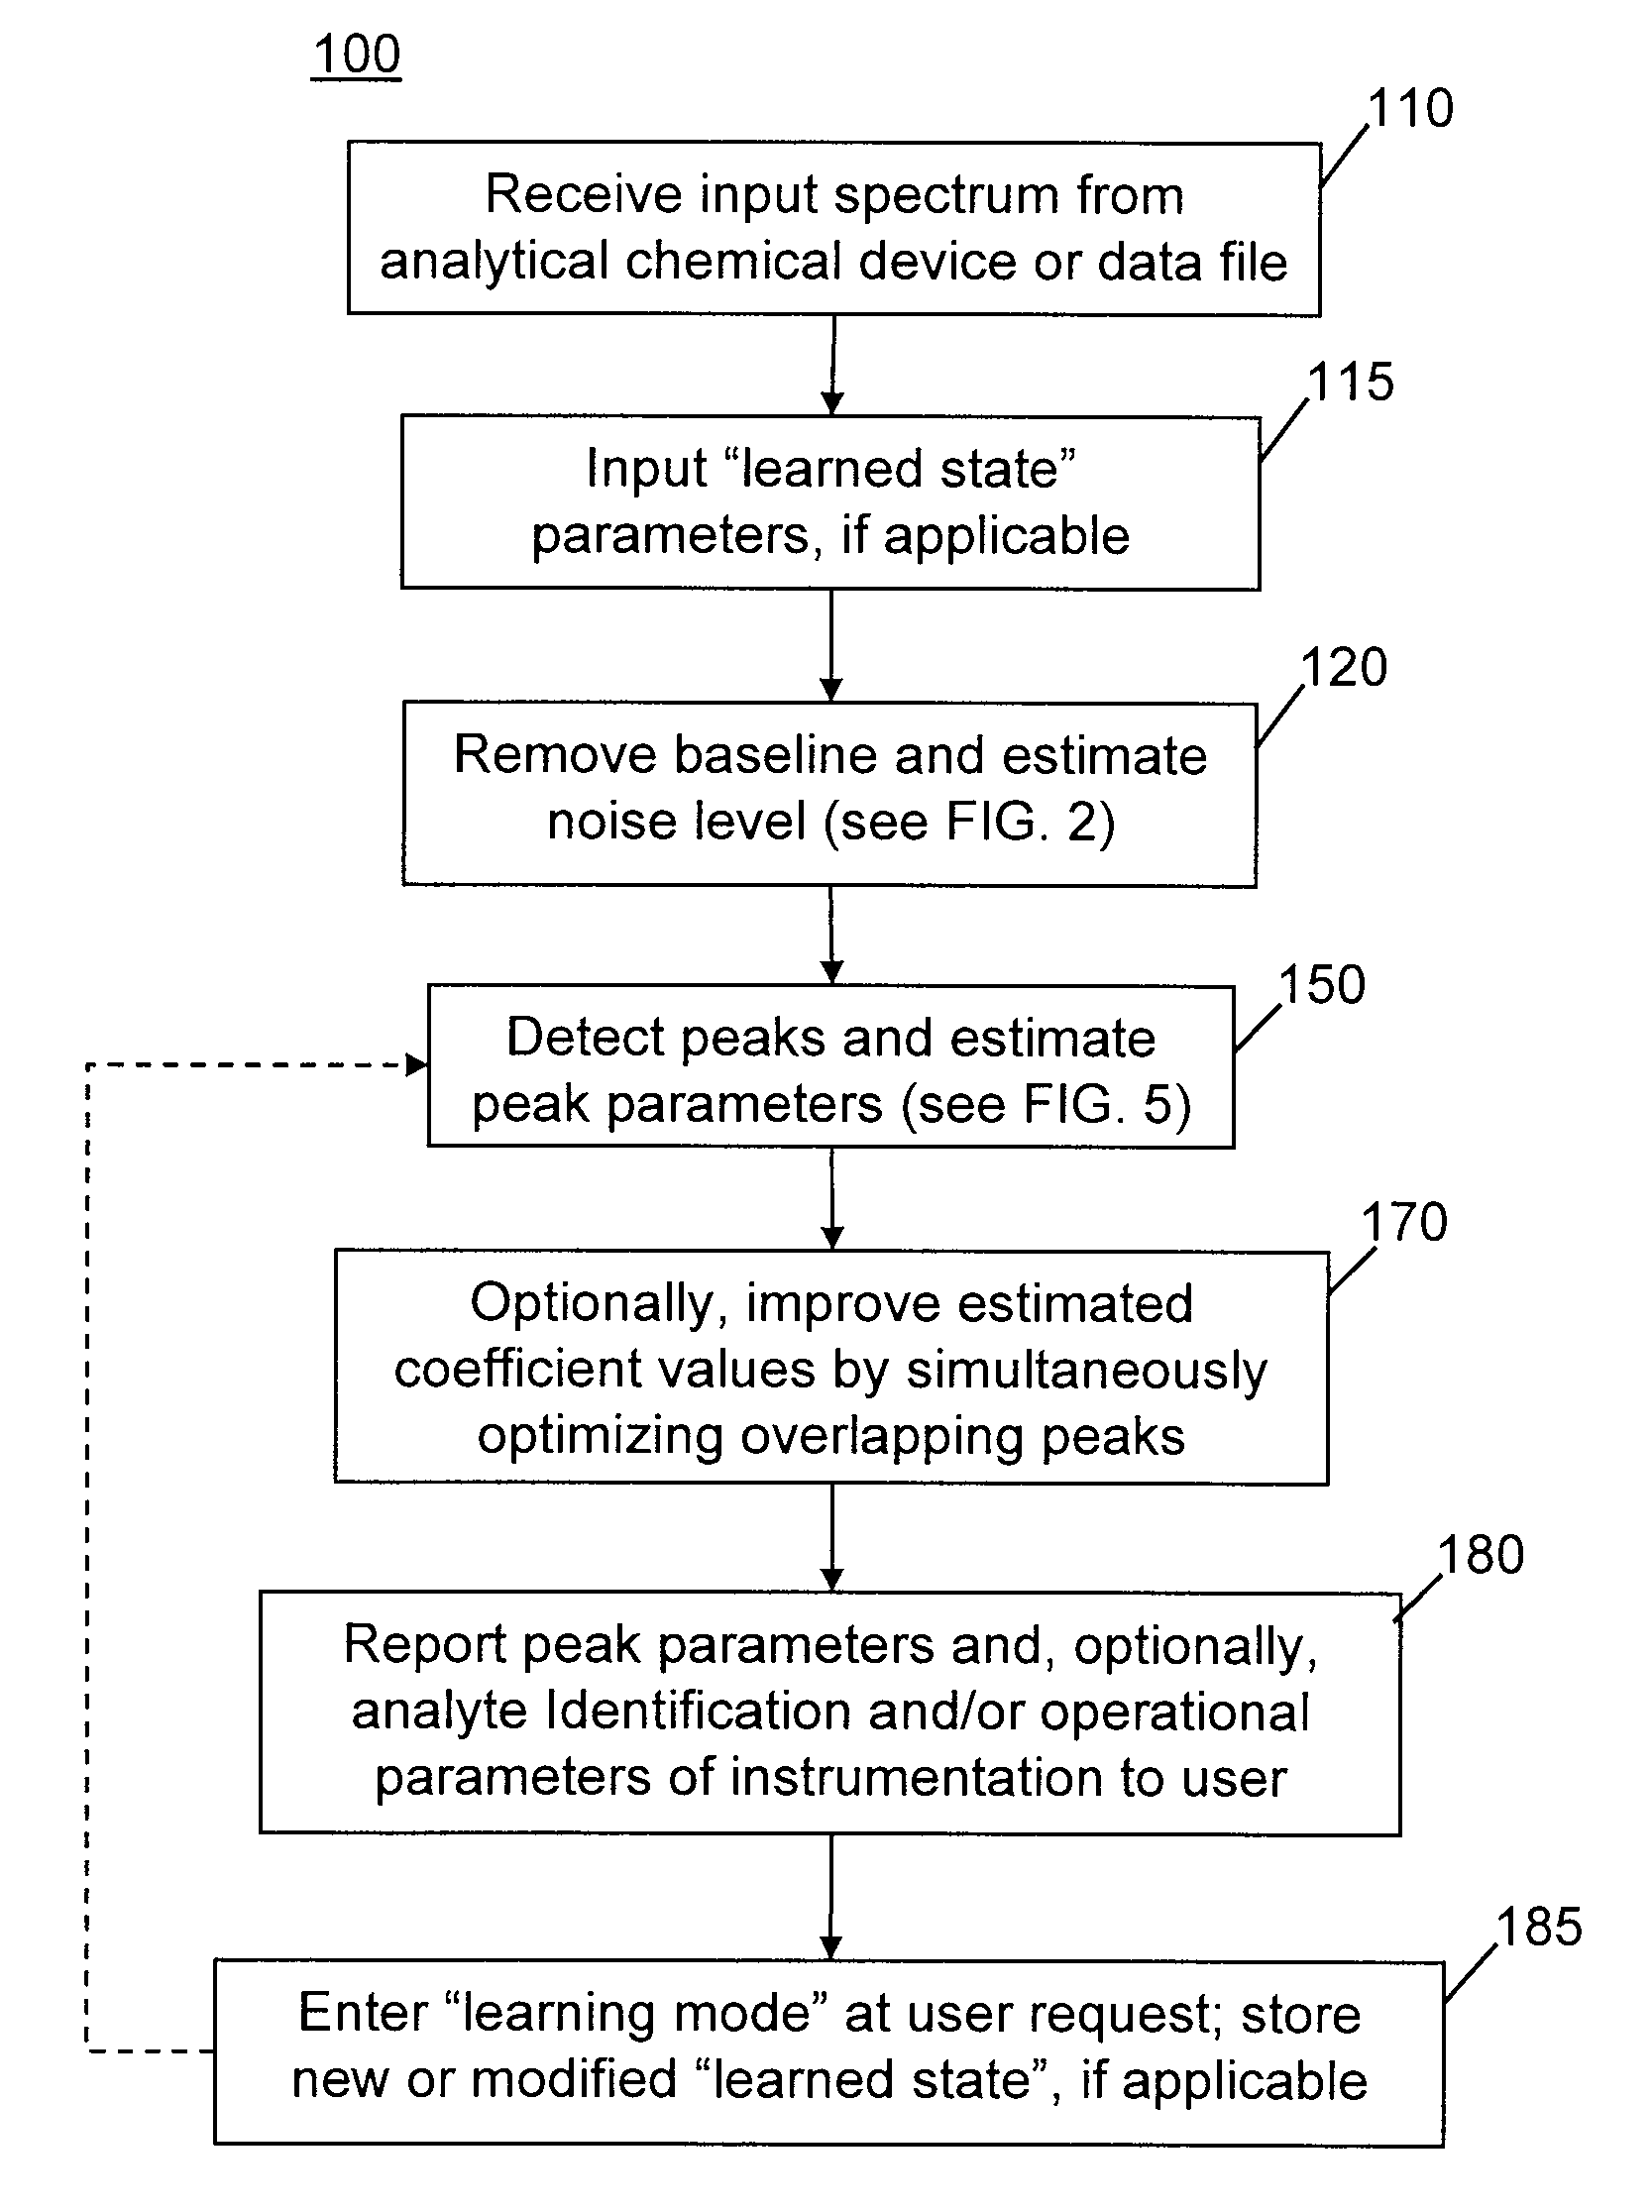
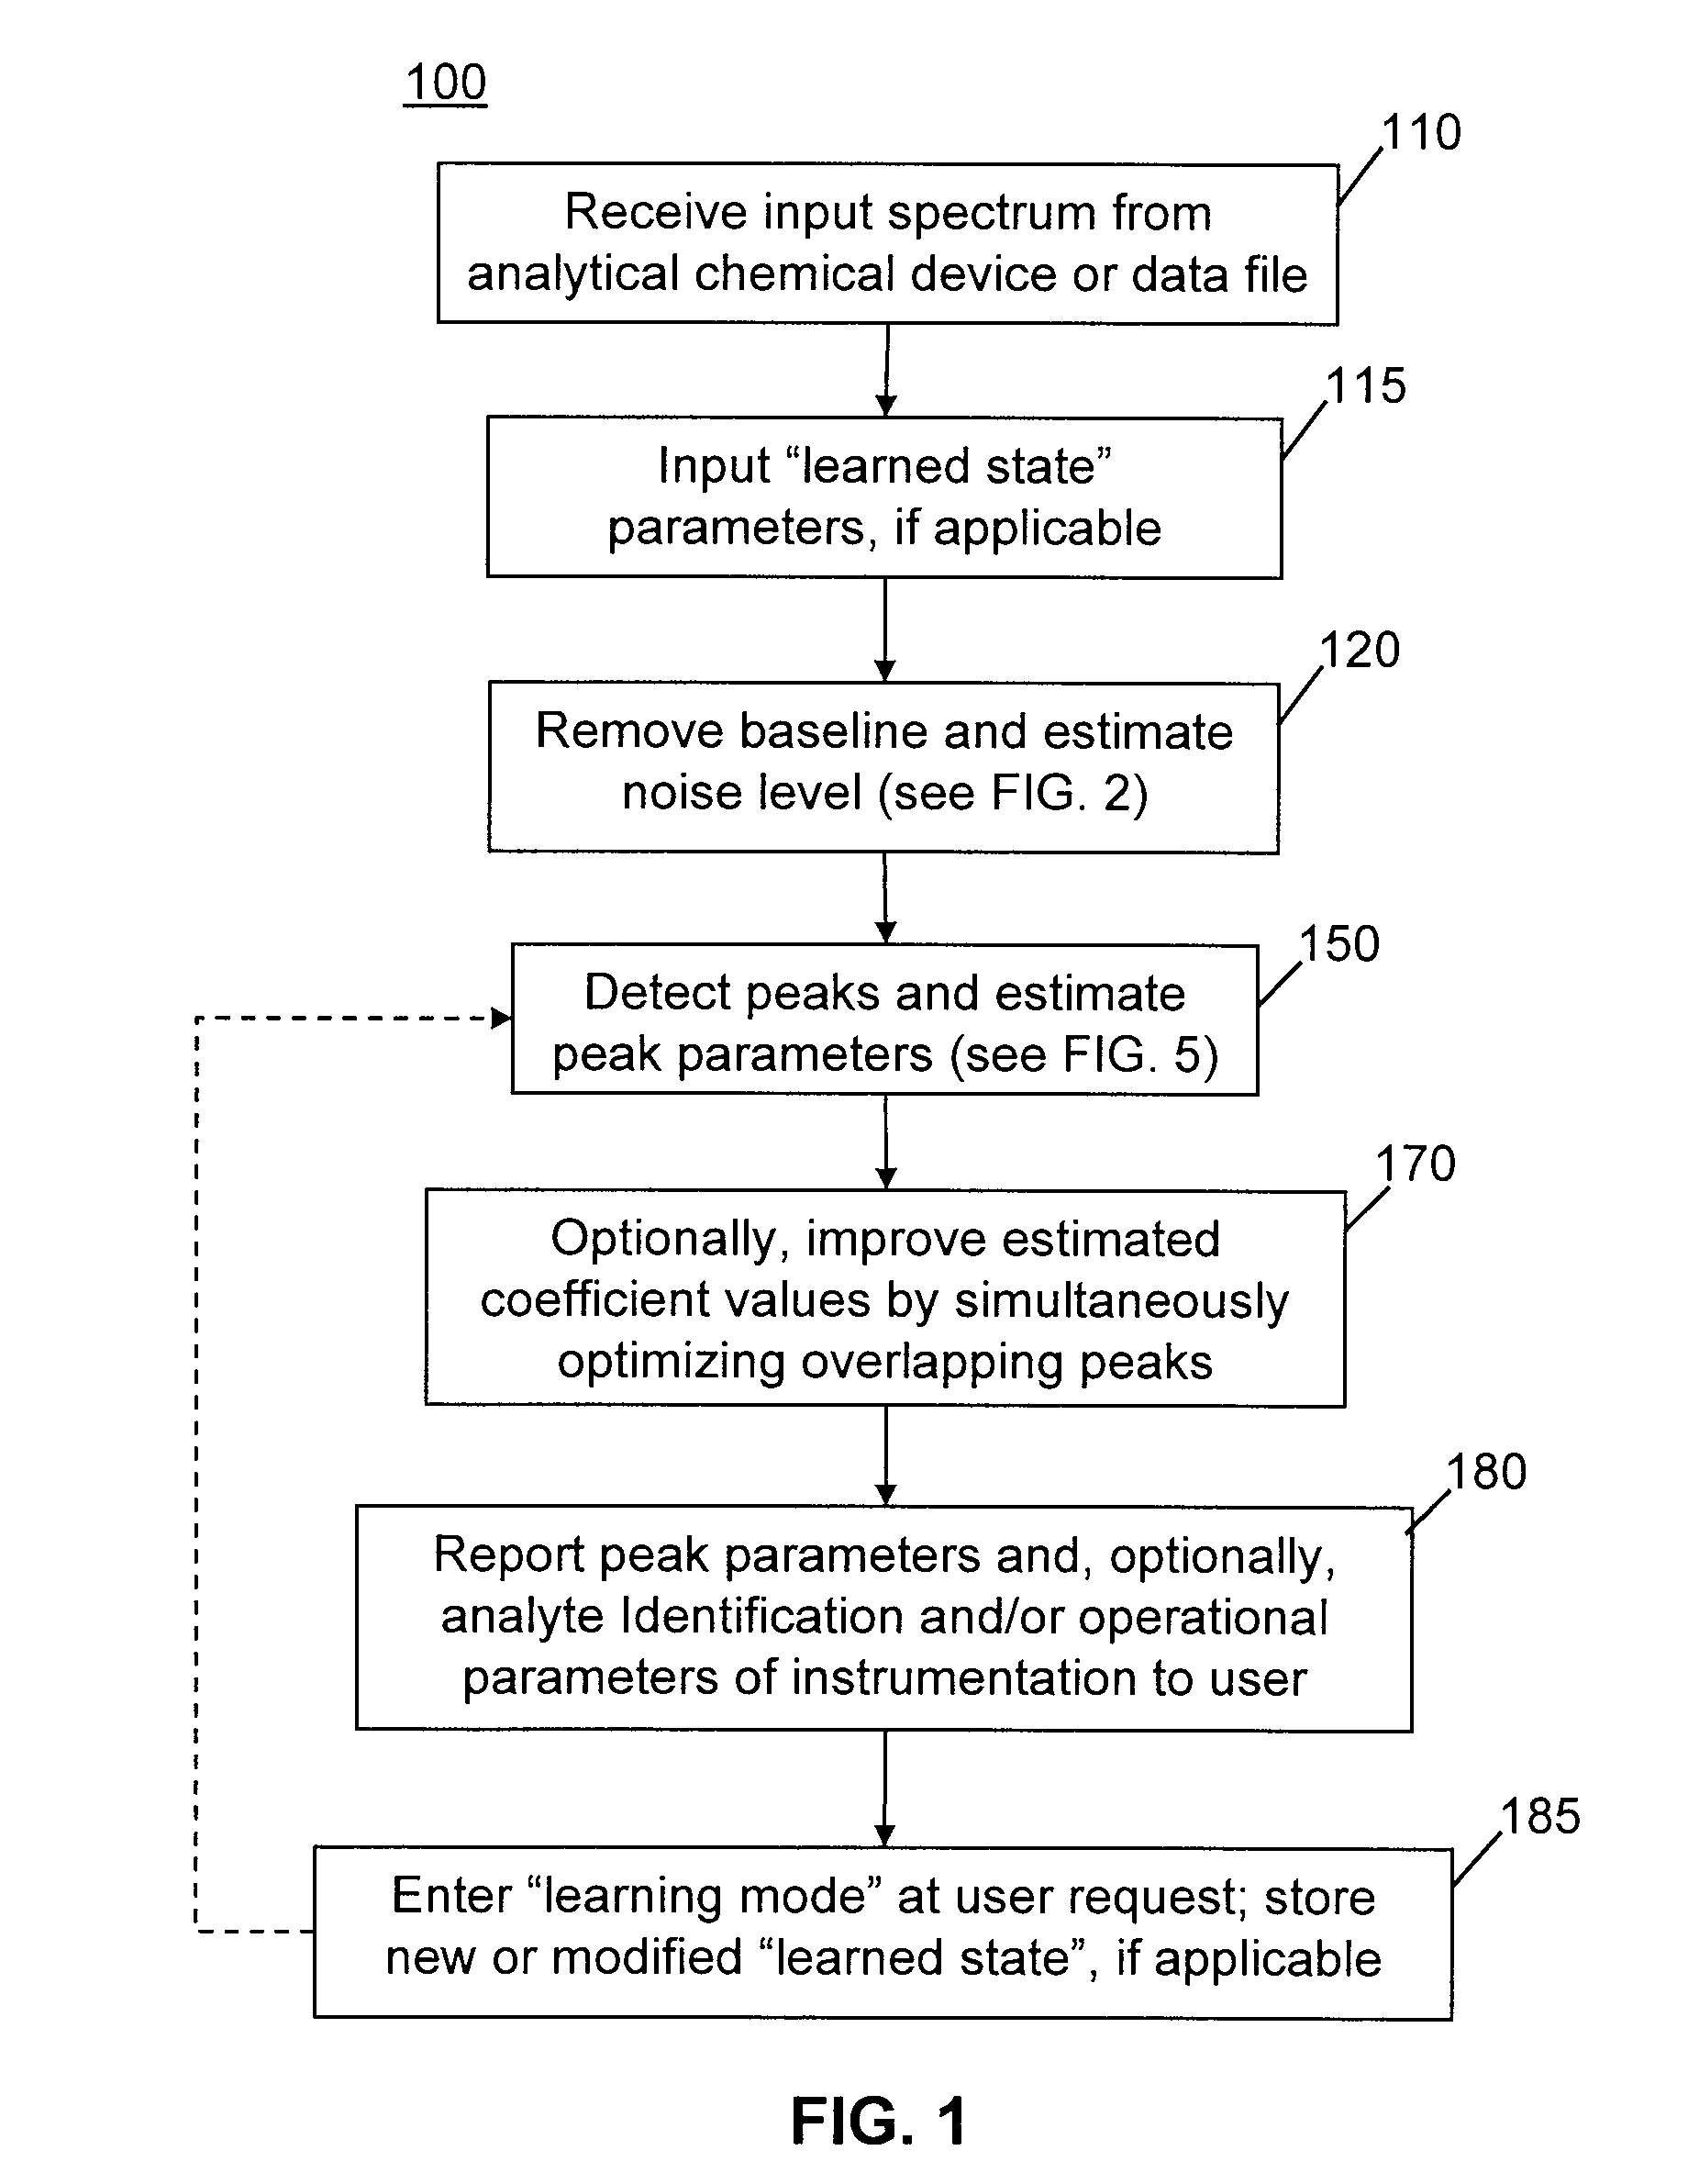
[0053]The present invention provides methods of automated spectral peak detection and quantification that do not require any user input or intervention during the peak detection process but which do allow for users to interactively teach any particular implementation of the methods how to improve its accuracy and precision in subsequent peak detection processes. The methods described herein can accommodate and model all types of spectral data, where the term “spectral data” is broadly defined as described above, and provide robust automatic detection, integration and reporting of spectral peaks. Any and even all model parameters utilized in these methods may be adaptively determined in a manner that is invisible to the user. The following description is presented to enable any person skilled in the art to make and use the invention, and is provided in the context of a particular application and its requirements. Various modifications to the described embodiments will be readily appa...


PUM


Abstract

There is provided a method of automatically identifying and characterizing spectral peaks of a spectrum generated by an analytical apparatus comprising the steps of: receiving the spectrum generated by the analytical apparatus; automatically subtracting a baseline from the spectrum so as to generate a baseline-corrected spectrum; automatically detecting and characterizing the spectral peaks in the baseline-corrected spectrum; reporting the detected and characterized spectral peaks to a user; receiving a list of adjustments to be made to the detecting and characterizing step from the user; and adjusting exit values used in the detecting and characterizing step, based on the list of adjustments.

Description

FIELD OF THE INVENTION[0001]This invention relates to methods of analyzing data obtained from instrumental analysis techniques used in analytical chemistry and, in particular, to methods of automatically identifying peaks in liquid chromatograms, gas chromatograms, mass chromatograms or optical or other spectra without input from or intervention of a user.BACKGROUND OF THE INVENTION[0002]The various techniques of instrumental analysis used in the broad field of analytical chemistry have been developed and refined primarily over the last century. Many of these techniques involve complex interactions of electromagnetic radiation with samples, possibly containing unknown substances to be identified or characterized. Such techniques include the spectroscopic techniques atomic absorption spectroscopy, atomic emission spectroscopy, UV-visible spectroscopy, infrared spectroscopy, NMR spectroscopy and Raman spectroscopy, among others. Other techniques, such as liquid chromatography (LC), ga...

Claims


Application Information

Patent Timeline
Patent Type & Authority Patents(United States)
IPC IPC(8): G06F19/00
CPCG01J3/28G01N30/8624G06F19/703H01J49/0036G06K9/6263G06K9/0053G01N30/8662G16C20/20G06F2218/10G06F18/2178
Inventor WRIGHT, DAVID A.
Owner THERMO FINNIGAN
Why Eureka
Try Eureka