
Method for determining relation between built-up environment and rail passenger flow distribution based on signaling data

A technology of signaling data and passenger flow distribution, applied in data processing applications, instruments, climate change adaptation, etc., to achieve the effect of strong real-time dynamics and wide coverage of the population

Pending Publication Date: 2020-06-02
SOUTHWEST JIAOTONG UNIV
View PDF4 Cites 19 Cited by
  • Summary
  • Abstract
  • Description
  • Claims
  • Application Information

AI Technical Summary

Problems solved by technology

[0006] In order to overcome the above-mentioned shortcomings of the prior art, the present invention proposes a method for determining the relationship between the built environment and rail passenger flow distribution based on signaling data, aiming to solve the problem of extracting factors affecting rail transit passenger flow based on mobile phone signaling data and urban built environment within the city , especially the influencing factors of passenger flow of various types of stations in different urban areas under the complex urban development and construction environment
Among them, the factors affecting the passenger flow of various types of stations in different urban areas under the comprehensive and complex urban development and construction environment are analyzed in particular

Method used


Image

  • Method for determining relation between built-up environment and rail passenger flow distribution based on signaling data
  • Method for determining relation between built-up environment and rail passenger flow distribution based on signaling data
  • Method for determining relation between built-up environment and rail passenger flow distribution based on signaling data

Examples


Embodiment Construction

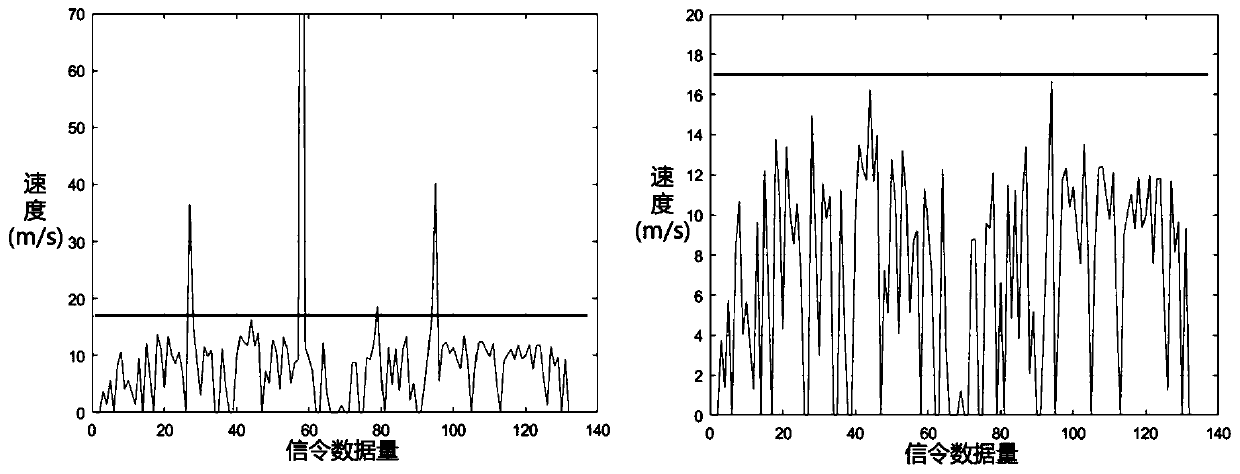
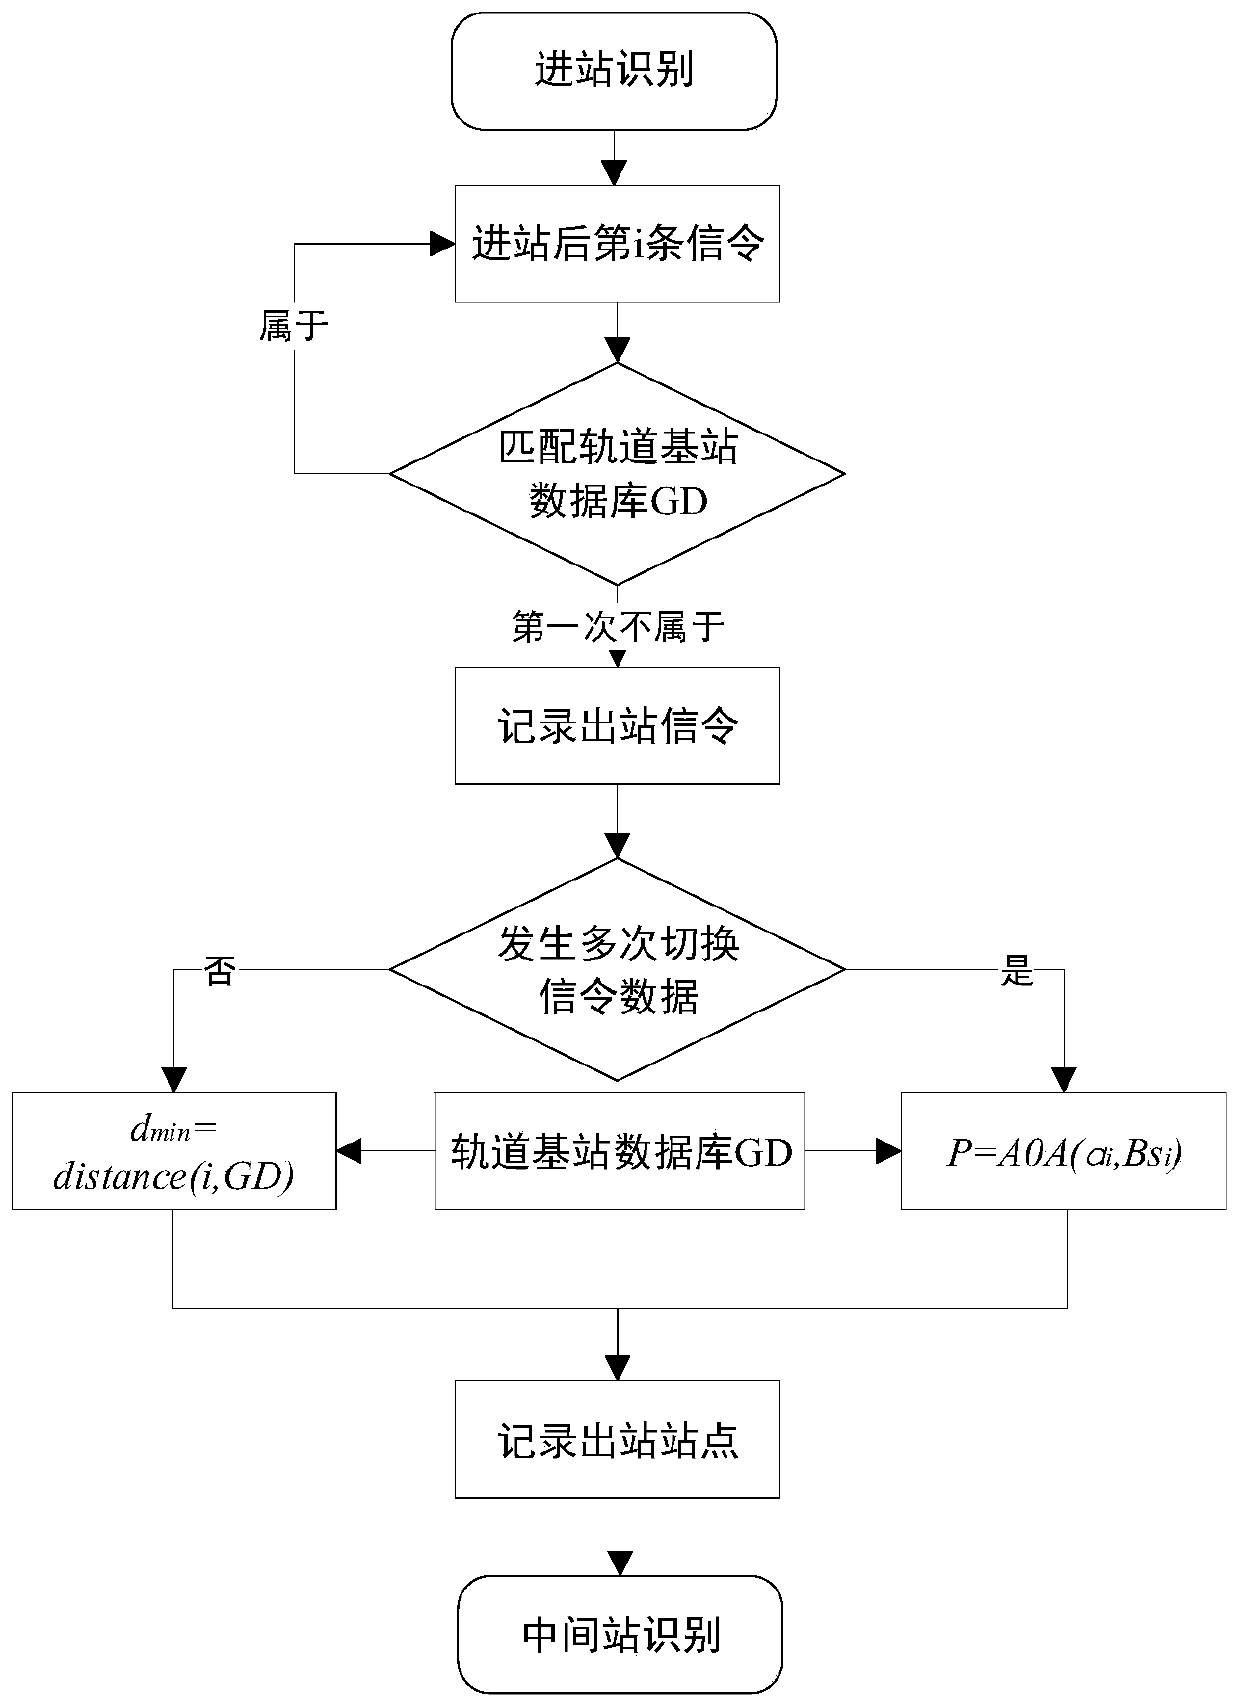
[0032] First, each field of the signaling data of the mobile phone involved in the present invention is analyzed.

[0033] (1) Cell phone signaling data

[0034] After a signaling event is triggered, the detection and analysis generation interface can obtain corresponding signaling data, including: mobile phone signaling data generated by mobile phone switching, mainly including mobile station identification number (Mobile Station ID, MSID), timestamp (Timestamp), Location area (LAC), cell ID (CID), event number (EVENTID) and other information, the specific meanings of the main fields of mobile phone signaling are as follows.

[0035] The mobile station identification number (MSID) is obtained by processing the mobile subscriber identification number (IMSI), and is a 32-bit unique number for identifying individual mobile users in the cellular mobile communication network. The IMSI structure is the 15-digit code of the mobile country code MCC + mobile network number + mobile s...


PUM


Abstract

The invention discloses a method for determining relation between the built-up environment and rail passenger flow distribution based on signaling data. On the basis of mobile phone signaling data generated by individuals every day, a space-time clustering algorithm is used to sort the mobile phone signaling data of the rail station passenger flow according to the personal identification number and the triggering time; the data is preprocessed, identification of distribution places of passenger flow around a rail station point is completed by using a space-time threshold algorithm, and hot spot areas of the rail passenger flow distributed around the station are identified by using a space-time clustering algorithm rule and taking the number of rail passengers of a base station as a clustering cluster. Then, on the basis of extracting the number of various public infrastructures in the urban built-up environment in the hot spot area, a correlation structure equation model of the passenger flow distribution number and the number of built-up environment facilities is established, and the correlation relationship between passenger flow distribution and the built-up environment is analyzed; the method can be used for evaluating the influence degree and the correlation relationship of the built environments of different regions of the city on the rail passenger flow distribution.

Description

technical field [0001] The invention belongs to the field of signaling data information identification of traffic big data, especially for the fields of rail transit line network planning, rail station optimization, and urban planning around rail stations. The degree of influence and correlation relationship provide quantitative analysis technical support for it. Background technique [0002] With the continuous expansion of cities in various countries, the travel characteristics of residents are gradually diversified. Since long-distance and large-capacity rail transit can meet the main travel needs of urban residents, it has become the backbone of urban transportation. However, the source and destination distribution of passenger flow at rail transit stations, and whether it will follow the expected results of relevant plans have always been the concern of industry planners and government departments. Generally, rail transit construction can improve regional traffic acces...

Claims


Application Information

Patent Timeline
Patent Type & Authority Applications(China)
IPC IPC(8): G06Q10/06G06Q50/26
CPCG06Q10/0639G06Q50/26Y02A30/60
Inventor 杨飞王利雷郭煜东
Owner SOUTHWEST JIAOTONG UNIV
Learn More