Marker for evaluating gemcitabine chemosensitivity of intrahepatic cholangiocarcinoma and application of marker
A technique for intrahepatic cholangiocarcinoma and gemcitabine, which is applied in the field of medical biological detection
- Summary
- Abstract
- Description
- Claims
- Application Information
AI Technical Summary
Problems solved by technology
Method used
Image
Examples
Embodiment 1
[0048] Embodiment 1: Peripheral blood sample processing
[0049] 1. Sample processing
[0050] Peripheral blood was obtained from 20 ICC patients (8 of whom were sensitive to chemotherapy and 12 of whom were insensitive to chemotherapy) in the Eastern Hepatobiliary Surgery Hospital, who were treated with gemcitabine chemotherapy.
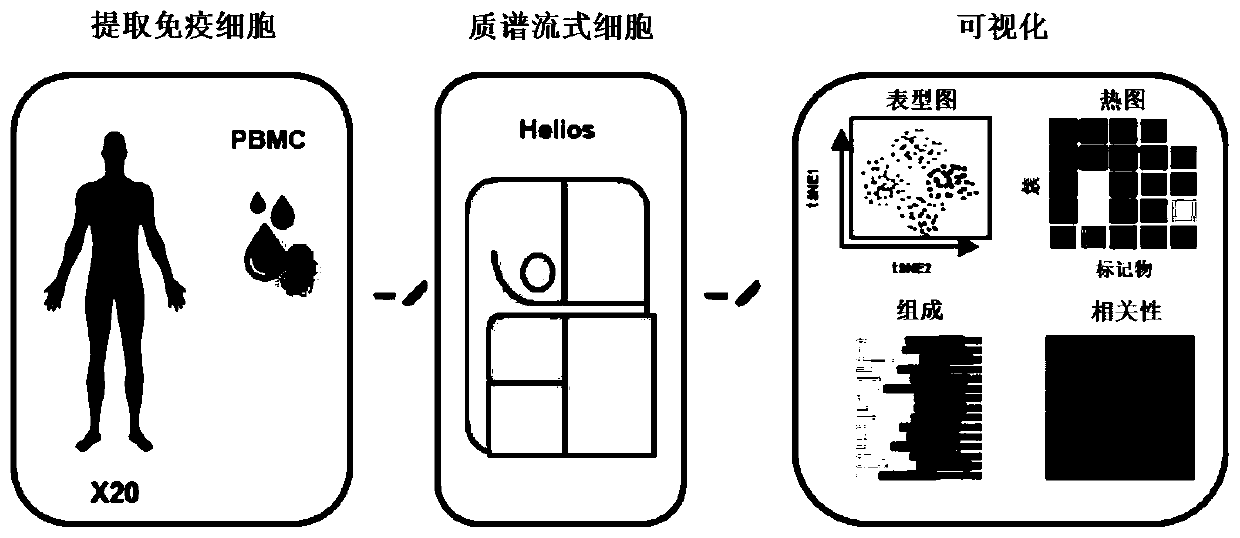
[0051] The overall workflow for isolating leukocytes from peripheral blood for CyTOF analysis is as follows: figure 1 shown. 2 mL of peripheral blood was collected at three time points before, during and after chemotherapy, and a total of 49 samples were obtained for this experiment. All samples were anonymously coded in accordance with local ethical guidelines.
[0052] 2. Isolation of white blood cells from peripheral blood
[0053] Leukocytes were separated from the fresh peripheral blood described above to obtain 20 groups of peripheral blood mononuclear cells (PBMC).
[0054] The specific steps are:
[0055] Dilute whole blood samples 1:1...
Embodiment 2
[0089] Example 2 Spatial heterogeneity analysis of peripheral blood immune microenvironment in intrahepatic cholangiocarcinoma
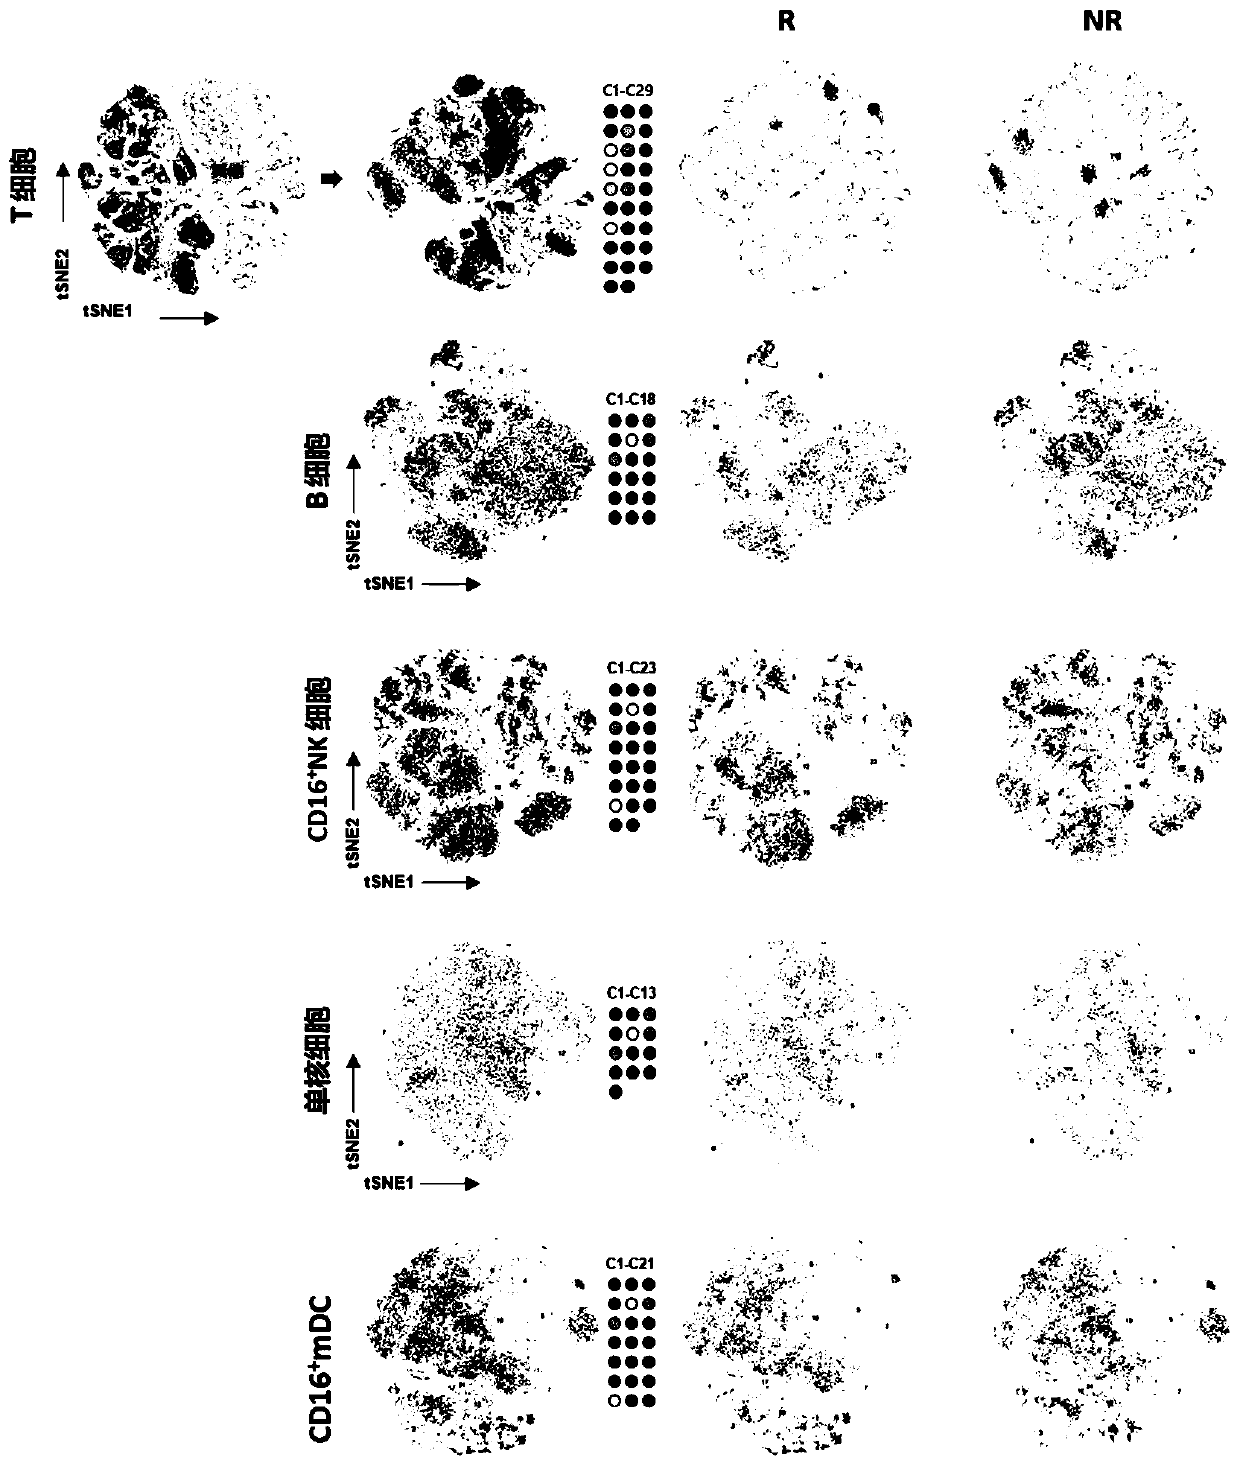
[0090] This example collects high-dimensional single-cell proteomic profiles from nearly 20,000,000 leukocytes (an average of approximately 450,000 cells per sample). The distribution of the immune lineage is visualized by tSNE as shown in figure 2 Shown: There are significant differences in the number of T cells, B cells, NK cells, monocytes, and mDCs in the peripheral blood of R (chemotherapy sensitive) and NR (chemotherapy insensitive) patients with ICC. This indicates that there is great heterogeneity in the peripheral blood immune microenvironment among different ICC patients.
Embodiment 3
[0091] Example 3 Individual differences of T cell clusters and CXCR3 before chemotherapy + Distribution characteristics of T cells
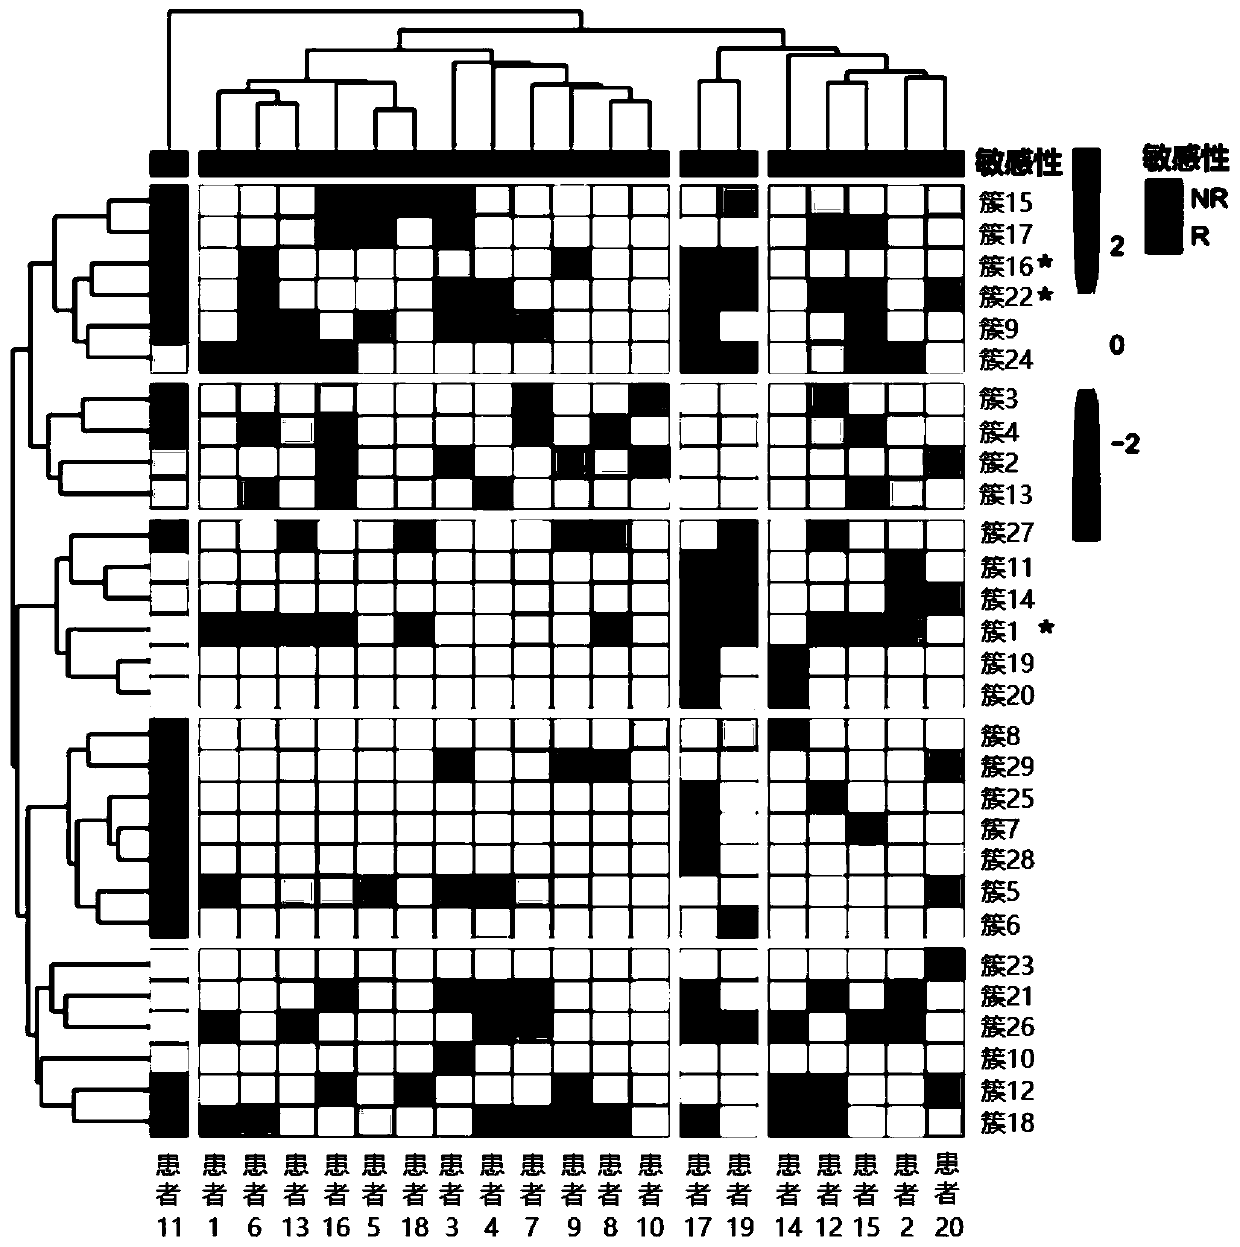
[0092] To investigate T cell subset composition in R versus NR patients, we visualized and reanalyzed T cell subsets. By applying the FlowSOM algorithm, T cells can be divided into 29 clusters (cluster) (including all T cells from 20 patients at three time points for analysis) ( image 3 and Figure 4 ). There were significant differences in T cell clusters among different individuals (clusters 1, 16, and 22 were more significant), and R and NR patients could not be well clustered and separated.
[0093] In order to further search for commonalities and differences between R and NR, we clustered the T cells of the samples at three time points with the above-mentioned significantly different T cell clusters (clusters 1, 16, 22) ( Figure 5 ). Before gemcitabine treatment, clusters 1, 16, and 22 of the two groups of patients with different chem...
PUM
 Abstract
Description
Claims
Application Information
 - R&D
- Intellectual Property
- Life Sciences
- Materials
- Tech Scout
- Unparalleled Data Quality
- Higher Quality Content
- 60% Fewer Hallucinations
Browse by: Latest US Patents, China's latest patents, Technical Efficacy Thesaurus, Application Domain, Technology Topic, Popular Technical Reports.
© 2025 PatSnap. All rights reserved.Legal|Privacy policy|Modern Slavery Act Transparency Statement|Sitemap|About US| Contact US: help@patsnap.com


