Tire rubber mixing production energy management system
A technology for energy production and management systems, applied in the energy industry, general control systems, control/regulation systems, etc., can solve the problems of energy management stagnation, lack of unified standards, lack of real-time and accuracy, etc., to ensure accuracy, The effect of reducing workload
- Summary
- Abstract
- Description
- Claims
- Application Information
AI Technical Summary
Problems solved by technology
Method used
Image

Examples
Embodiment Construction
[0020] The specific embodiments of the rubber mixing production energy management system will be described in detail below in conjunction with the accompanying drawings. It is to be understood that the disclosed embodiments are merely examples of the ways in which certain aspects of the application may be practiced, and do not represent an exhaustive list of all the ways in which the invention may be practiced. Any specific structural and functional details disclosed herein are not to be interpreted as limiting.
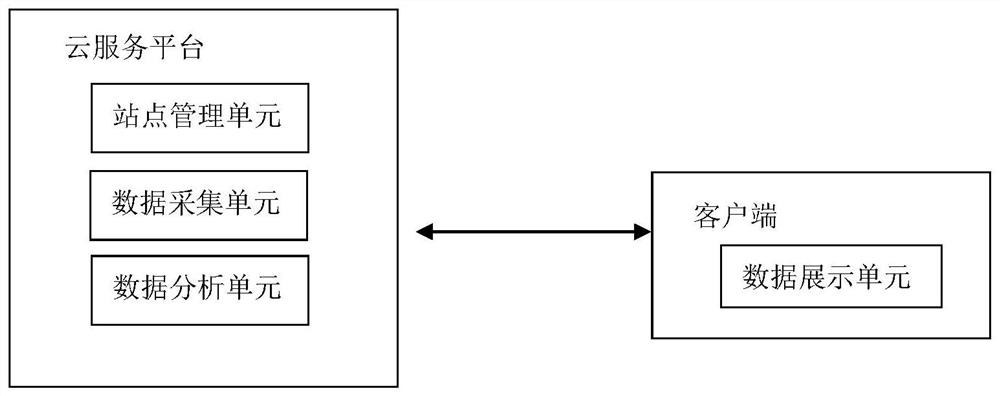
[0021] refer to figure 1 An energy management system for tire rubber production is shown, which includes a cloud service platform and a client, one or more clients access the cloud service platform, and data interaction is performed between the cloud service platform and the client.
[0022] combine figure 2 , the cloud service platform includes a site management unit, a data acquisition unit, and a data analysis unit, and the client includes a data display unit. ...
PUM
 Abstract
Description
Claims
Application Information
PatSnap Eureka turns technology decisions into work you can execute. Powered by our Innovation Knowledge Graph, it runs expert workflows across engineering, life sciences, materials and intellectual property. Get your review-ready output in minutes.


