CAD-based visual gas pipe network static simulation system and calculation method thereof

A static simulation and simulation calculation technology, applied in geometric CAD, special data processing applications, etc., can solve problems such as difficult error checking, slow input data speed, slow calculation speed, etc., so as not to increase the complexity of the pipe network and reduce the calculation time , The effect of simplifying the gas pipeline network

Pending Publication Date: 2020-11-06
姚成蔚
View PDF4 Cites 8 Cited by
  • Summary
  • Abstract
  • Description
  • Claims
  • Application Information

AI Technical Summary

Problems solved by technology

[0004] At present, in the first stage of the hydraulic calculation of the same kind of gas pipeline network, the data is obtained from the outside world. At present, the input method of most of the hydraulic calculation of the gas pipeline network is similar to the Excel file. Although the data can also be input, it is not intuitive, and the topology of the gas pipeline network cannot be seen. , such as using the dos version of the hydraulic adjustment software to manually input data, resulting in slow data input, not intuitive, error-prone and difficult to check for errors, and some horizontal adjustment software can also input data from CAD, but the support for CAD Limited, only supports Autocad or supports a specific version of a certain CAD, such as gnet, the specific version of the hydraulic adjustment software can only read data from a specific CAD version, there are great limitations in use, and CAD If files are used to store data, there are still many limitations. Most of the CAD primitives are line segments, polylines, text, etc. If they are used to represe

Method used


Image

  • CAD-based visual gas pipe network static simulation system and calculation method thereof
  • CAD-based visual gas pipe network static simulation system and calculation method thereof
  • CAD-based visual gas pipe network static simulation system and calculation method thereof

Examples


Embodiment 1

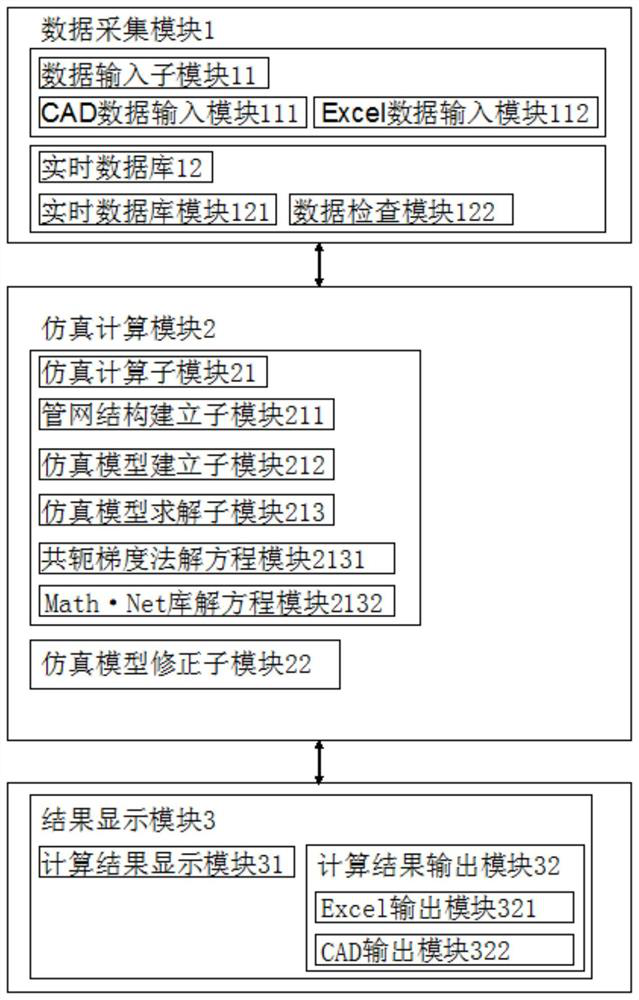
[0071] Based on the CAD visualization gas pipeline network static simulation system, it is used to simulate the gas pipeline network. The gas pipeline network static simulation system includes a data acquisition module 1, a simulation calculation module and a result display module. The data acquisition module 1 is connected with the simulation module respectively. The calculation module is connected with the result display module,

[0072] Described data collection module 1 comprises data input sub-module 11 and real-time database, and described data input sub-module 11 comprises CAD data input module 111 and EXCEL data input module 112;

[0073] The known parameters of the hydraulic calculation of the gas pipeline network are Excel table data or CAD file data. The CAD file data indicates that the gas pipeline network structure diagram includes: public data, node data, area flow data and pipe section data. The public data, node Data and regional flow data are respectively repr...

specific Embodiment 1

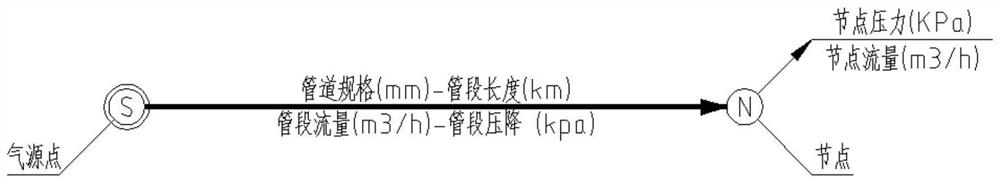
[0112] Establish the pipeline network in CAD and draw the corresponding gas pipeline network structure diagram. In order to facilitate the establishment of the gas pipeline network structure diagram, first generate a sample diagram in CAD. For the sample diagram, see image 3 As shown, the gas pipeline network static simulation system can support most versions of GstarCAD, ZWCAD, ZWCAD+ and AutoCAD at the same time. The gas pipeline network structure diagram includes: public data, node data, regional flow data and pipe sections data, the public data, node data, and regional flow data are respectively represented by public data attribute blocks, node data attribute blocks, and regional flow data attribute blocks, and the pipe section data are directly represented by polylines; public data include kinematic viscosity, gas Density, design temperature, discharge flow, pipe roughness, local resistance, calculation accuracy, minimum pressure, text height, circle radius, grid spacing ...

specific Embodiment 2

[0131] refer to Image 6 , Image 6 It is a schematic diagram of the partial pipeline network structure of 37 nodes, in which 1 is the gas source, and 2-37 are gas consumption points, which are nodes in the gas pipeline network structure diagram, and the gas consumption of node 2 is 100 cubic meters, and nodes 3, 5, 7, and 9 , 11, 14, 15, 19, 20, 25-27, 30, 33-35 node gas consumption is 10 cubic meters, node 4 gas consumption is 10 cubic meters, node 6 gas consumption is 36 cubic meters, node 8 gas consumption is 12 cubic meters , the gas consumption of node 10 is 89 cubic meters, the gas consumption of node 12 is 246 cubic meters, the gas consumption of node 13 is 116 cubic meters, the gas consumption of node 16 is 40 cubic meters, the gas consumption of node 17 is 130 cubic meters, the gas consumption of node 18 is 68 cubic meters, and the gas consumption of node 21 is 0 cubic meters , node 22 is 340 square, node 23 is 316 square, node 24 is 137 square, node 28 is 179 squar...


PUM


Abstract

The invention discloses a CAD-based visual gas pipe network static simulation system and a calculation method thereof, thereby carrying out simulation calculation on a gas pipe network. The system comprises a data acquisition module, a simulation calculation module and a result display module. The data acquisition module comprises a CAD data input module; the CAD data input module is used for inputting known parameters of hydraulic calculation of a gas pipe network into a real-time database module for storage through a visual CAD graphic environment; the simulation calculation sub-module acquires known hydraulic calculation parameters of the gas pipe network, establishes a gas pipe network simulation model, establishes a node pressure equation set according to known hydraulic calculation parameters of the gas pipe network, and calls a simulation model solving sub-module to solve the gas pipe network simulation model to obtain parameters to be solved, and displays, outputs and stores the calculated values of the parameters to be solved and the known hydraulic calculation parameters of the gas pipe network through an Excel data table or a CAD graph.

Description

technical field [0001] The invention relates to the field of hydraulic calculation, in particular to a CAD-based visualization gas pipeline network static simulation system and a calculation method thereof. Background technique [0002] The hydraulic calculation of the gas pipeline network is an important task in the design of the urban gas pipeline network. The main task of the hydraulic calculation of the gas pipeline network is to calculate the diameter of the pipeline according to the calculated flow rate of the gas and the allowable pressure loss, so as to determine the pipeline investment and pipe material consumption. Calculate the flow rate and pressure loss of the existing pipeline to fully utilize the gas transmission capacity of the pipeline, or decide whether the original pipeline needs to be modified. [0003] The hydraulic calculation of the gas pipeline network is generally divided into three stages: the first stage is to obtain data from the outside world, th...

Claims


Application Information

Patent Timeline
IPC IPC(8): G06F30/18
CPCG06F30/18
Inventor 姚成蔚
Owner 姚成蔚
Why Eureka
Try Eureka