
High-risk food and hazardous substance visual analysis method and system based on graph embedding

An analytical method and high-risk technology, applied in the field of visual exploration methods and systems for high-risk foods and hazardous substances, which can solve food testing items that cannot take into account the potential risks found, and it is difficult to display large-scale data correlation networks. All nodes and Relationships, it is difficult for users to discover and mine entities and relationships, etc.

Active Publication Date: 2020-12-29
BEIJING TECHNOLOGY AND BUSINESS UNIVERSITY
View PDF6 Cites 4 Cited by
  • Summary
  • Abstract
  • Description
  • Claims
  • Application Information

AI Technical Summary

Problems solved by technology

The existing statistical analysis methods can quickly discover the distribution characteristics of the detection data, but it is difficult to display all the nodes and relationships of the large-scale data association network; the existing exploration methods for high-risk foods and high-risk detection items are based on the detection results Compared with the limit standard, it is impossible to consider the relationship between foods to find potentially risky foods and problems with testing items; it is difficult for users to discover and mine the entities and relationships that need to be focused on, as well as the hidden correlation patterns. It is difficult to analyze and warn potential food safety hazards

Method used


Image

  • High-risk food and hazardous substance visual analysis method and system based on graph embedding
  • High-risk food and hazardous substance visual analysis method and system based on graph embedding
  • High-risk food and hazardous substance visual analysis method and system based on graph embedding

Examples


Embodiment Construction

[0049] Below in conjunction with accompanying drawing, further describe the present invention by example, but do not limit the scope of the present invention in any way.

[0050] The invention provides a visual analysis, analysis and exploration method for high-risk food and hazards based on graph embedding. This method takes into account the structural characteristics of different subgraphs in the food association network and the relationship between each subgraph, and helps regulators discover high-risk foods and high-risk detection items through visual analysis and exploration. This method can be used for food risk early warning in the field of food safety, paper citation analysis in academia, social network exploration analysis, etc.

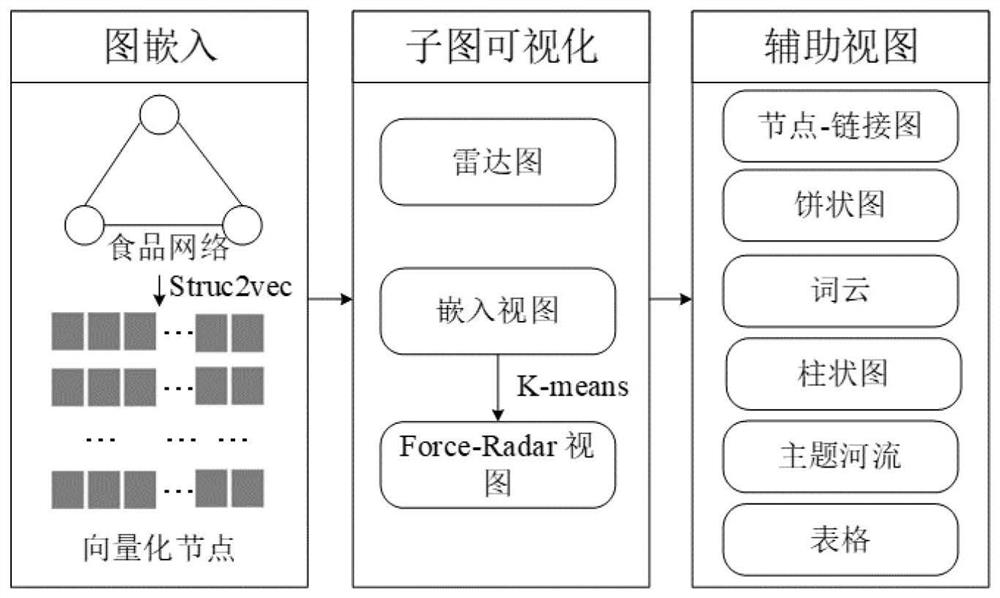
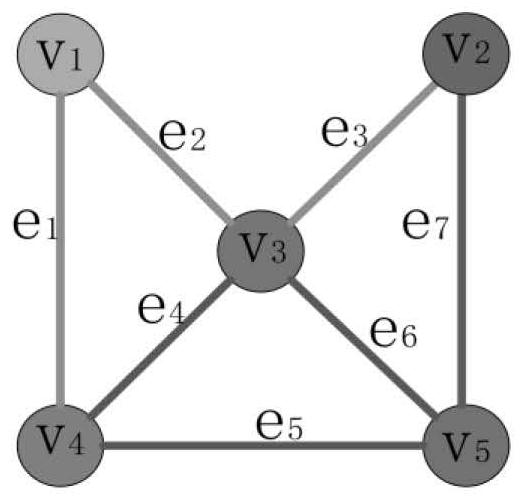
[0051] The method of the present invention first constructs a food association network. In the food association network, nodes represent food, and whether a common hazard is detected in two foods is a condition to establish an edge in the ne...


PUM


Abstract

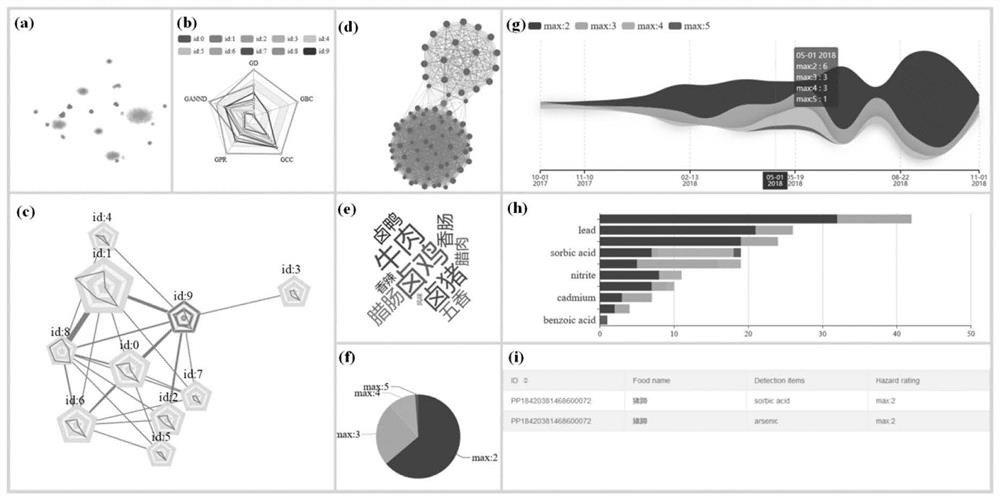
The invention discloses a high-risk food and hazardous substance visual analysis method and system based on graph embedding. The method comprises the following steps: building an edge through taking food as a node and whether a common hazardous substance is detected in the food or not, and constructing a food association network; vectorizing the nodes of the food association network; and clustering the vectorized nodes so as to divide the nodes with similar structural features into the same sub-graph. Force-Radar is visually designed to serve as a radar map for displaying characteristic indexes of sub-maps, correlation between the sub-maps serves as an edge, an overview map of the whole network is formed through force-oriented layout, and the relation among the overview of the whole food correlation network, the structural characteristics of the sub-maps and the sub-maps is effectively displayed. By adopting the method and the system, the food association network can be interactively analyzed and explored, high-risk food and harmful substances can be discovered, and support is provided for food safety supervision.

Description

technical field [0001] The invention relates to the technical fields of information visualization, graph model information mining, and food safety, and mainly relates to a graph embedding-based visual exploration method and system for high-risk foods and hazards. Background technique [0002] Food safety is an issue that everyone has to pay attention to in daily life. With the continuous improvement of people's living standards and awareness of rights protection, people's requirements for food safety and quality are getting higher and higher, so that ordinary people can eat safe and secure food It has become an important issue of people's livelihood that has been widely concerned by governments, academia and industry. To this end, the national food safety supervision department conducts random inspections of various foods in various places and obtains a large amount of inspection data. These data include food names, types, and names of inspection items and other entities and...

Claims


Application Information

Patent Timeline
IPC IPC(8): G06F16/33G06F16/36G06K9/62G06Q10/06
CPCG06F16/36G06F16/334G06Q10/0635G06F18/23213
Inventor 陈谊张梦录张清慧
Owner BEIJING TECHNOLOGY AND BUSINESS UNIVERSITY
Learn More