Air quality visual display method and air quality visual display system

A technology of air quality and display methods, which is applied in structured data retrieval, image data processing, instruments, etc., can solve the problems of inability to query and display air quality, achieve intuitive display results, overcome defects, and occupy less hardware resources.

Inactive Publication Date: 2021-03-12
3CLEAR SCI & TECH CO LTD
View PDF5 Cites 1 Cited by
  • Summary
  • Abstract
  • Description
  • Claims
  • Application Information

AI Technical Summary

Problems solved by technology

[0004] The defects of the above patent documents are: 1) In the scheme disclosed in the above patent, the air quality visual display system cannot query and display air quality through mobile terminals such as mobile phones; 2) In the air quality data map display module, the air quality displayed on the GIS map It is the current static air quality rendering, which cannot be played to allow users to quickly and intuitively see the change trend of air quality over a period of time, so it needs to be improved

Method used


Image

  • Air quality visual display method and air quality visual display system
  • Air quality visual display method and air quality visual display system

Examples


Embodiment Construction

[0024] The technical solution of the present invention will be described clearly and completely through the following embodiments. Obviously, the described embodiments are only some of the embodiments of the present invention, not all of them. Based on the embodiments of the present invention, all other embodiments obtained by persons of ordinary skill in the art without making creative efforts belong to the protection scope of the present invention.

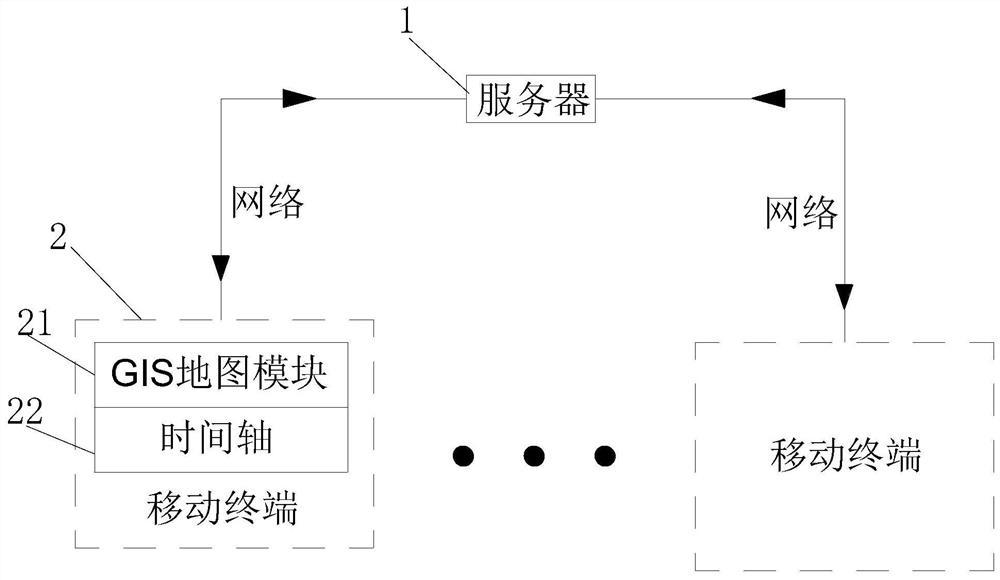
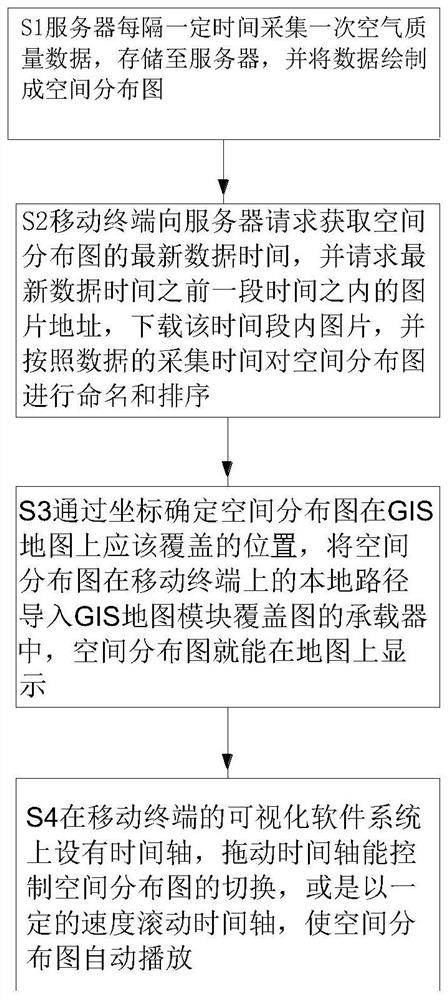
[0025]Such as figure 1 and figure 2 As shown, the air quality visualization display system of the present invention includes a server 1 and a mobile terminal 2 .

[0026] The server collects air quality data at regular intervals, usually at an interval of 1 hour. The collected data is stored in server 1, and the collected data can be drawn into a spatial distribution map of air quality, so that it can be drawn every hour. Create a map of the spatial distribution of air quality. When the server draws, first generate a backgro...


PUM


Abstract

The invention relates to the technical field of air quality detection, in particular to an air quality visual display method and an air quality visual display system. The method comprises the following steps: acquiring air quality data once at regular intervals through a server, and drawing a spatial distribution diagram of the air quality according to the acquired data; enabling the mobile terminal to request the server for obtaining the latest data time of the spatial distribution map, then request the server for a picture address within a certain period of time, download all the spatial distribution maps within the period of time, and then name and sort the spatial distribution maps; setting a visualization software system in the mobile terminal, the visualization software system beingprovided with a GIS map module, and the spatial distribution map can be displayed on the GIS map module; setting a time axis on a visual software system of the mobile terminal, and the time axis can be used for dragging and switching pictures or automatically playing the pictures. The condition and the change trend of the air quality can be visually seen, and a user can check the condition and thechange trend conveniently.

Description

technical field [0001] The invention belongs to the technical field of air quality detection, in particular to an air quality visual display method and an air quality visual display system. Background technique [0002] The traditional air quality visual display system usually displays the air quality in the form of points, the display effect is not beautiful enough, and thousands of points are displayed on the terminal device, which will cause the system to freeze, and each switch needs to be restarted. Loading thousands of points is a waste of terminal equipment resources. Moreover, the dense point map is not intuitive, and it is difficult for users to see the change trend of air quality, and the visibility is poor. [0003] The patent document with the publication number CN107038236A discloses a visual display system of air quality data, and specifically discloses that it includes a data acquisition module, which can obtain the corresponding air quality pollution degree ...

Claims


Application Information

Patent Timeline
Patent Type & Authority Applications(China)
IPC IPC(8): G06F16/22G06F16/29G06T11/00G06T11/20
CPCG06T11/001G06T11/206G06F16/2228G06F16/29
Inventor 牛瑞麟卓流艺计陆平秦东明
Owner 3CLEAR SCI & TECH CO LTD
Why Eureka
Try Eureka