Establishment method and application of model for evaluating composition of reconstituted tobacco pulp system
A technology for reconstituting tobacco leaves and pulp, applied in applications, data processing applications, special data processing applications, etc., can solve the problems that the beating degree and fiber wet weight cannot be completely and accurately reflected, and achieve the effect of improving the beating quality and control level.
- Summary
- Abstract
- Description
- Claims
- Application Information
AI Technical Summary
Problems solved by technology
Method used
Image
Examples
Embodiment 1
[0025] A method for establishing a composition model for evaluating reconstituted tobacco slurry system, the steps are:
[0026] (1) Slurry fiber quality analysis: take different formulations of slurry on the production line and use a fiber quality analyzer to analyze the fiber quality. The measurement method is: take an appropriate amount of slurry and fully dissolve it with a disperser, and take a certain amount of dispersed solution to be tested Pour into the FQA special measuring plastic cup, set the measuring fiber to 4000, the measuring range is 0.07-10mm, measure the fiber length and length interval distribution data of each slurry according to the FQA operating procedures, measure 5 sets of data sets for each sample and take average value;
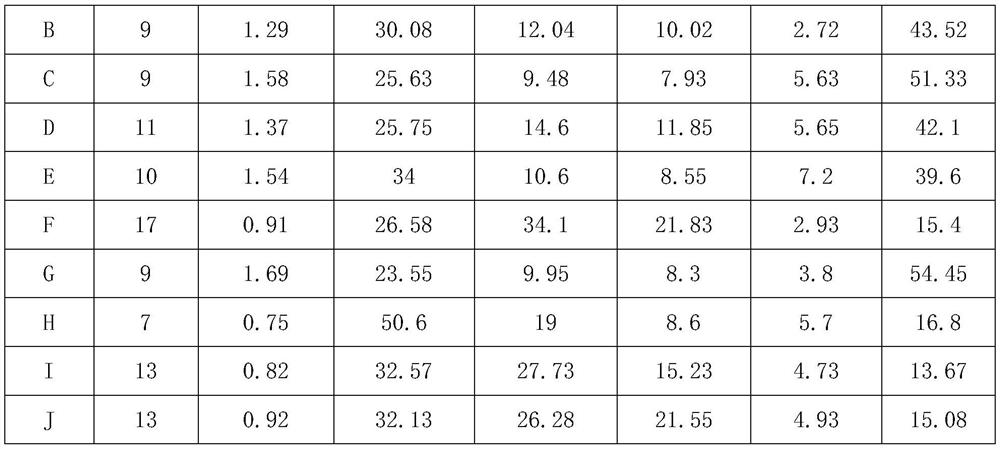
[0027] (2) Establishment of slurry composition model: by analyzing the average length of pulp fibers (average fiber length 0.20-0.53, 0.53-0.85, 0.85-1.18, 1.18-1.50, 1.50-mm), the addition ratio of additional fibers and the length...
Embodiment 2
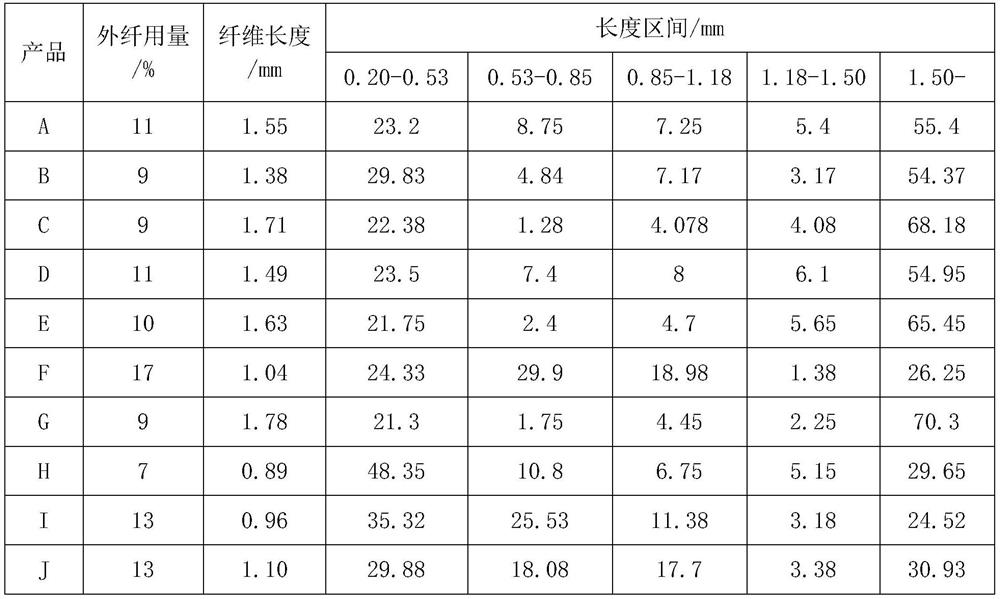
[0036] Table 1. Slurry Fiber Quality
[0037]
[0038] (1) Regression analysis is carried out to the pulp fiber quality (outside fiber consumption, fiber length, fiber length distribution interval) in Table 1: outside fiber consumption (Y 1 ) and fiber length distribution interval: 0.20-0.53(X 1 ), 0.53-0.85 (X 2 ), 0.85-1.18 (X 3 ), 1.18-1.50 (X 4 ), 1.50-(X 5 ) is in accordance with:
[0039] Y 1 =9.5-0.160*X 1 +0.254*X 2 +0.147*X 3 +0.152*X 4 +0.023*X 5 , R 2 =99.6%, the degree of correlation between the above indicators is relatively high.
[0040] variance analysis:
[0041] source degrees of freedom SS MS F P significant return 5 72.628 14.526 213.49 0.000 ** residual error 4 0.272 0.068 total 9 72.900
[0042] F 0.05 (5,4)=6.26,F 0.01 (5,4)=15.52, because F=213.49 >F 0.01 (5,4)=15.52, so the amount of outer fiber (Y 1 ) and fiber length distribution interval: 0.20-0.53(X 1 ), 0.53-0.85 ...
PUM
 Abstract
Description
Claims
Application Information
 - R&D
- Intellectual Property
- Life Sciences
- Materials
- Tech Scout
- Unparalleled Data Quality
- Higher Quality Content
- 60% Fewer Hallucinations
Browse by: Latest US Patents, China's latest patents, Technical Efficacy Thesaurus, Application Domain, Technology Topic, Popular Technical Reports.
© 2025 PatSnap. All rights reserved.Legal|Privacy policy|Modern Slavery Act Transparency Statement|Sitemap|About US| Contact US: help@patsnap.com


