Method for testing creep property of metal
A technology of metal creep and test method, applied in the direction of measuring device, strength characteristics, instrument, etc., can solve the problems of long test time and many samples used for creep performance test, and achieve short test time, simple test process, and metal creep. Variable performance and efficient effects
- Summary
- Abstract
- Description
- Claims
- Application Information
AI Technical Summary
Problems solved by technology
Method used
Image
Examples
Embodiment 1
[0063]
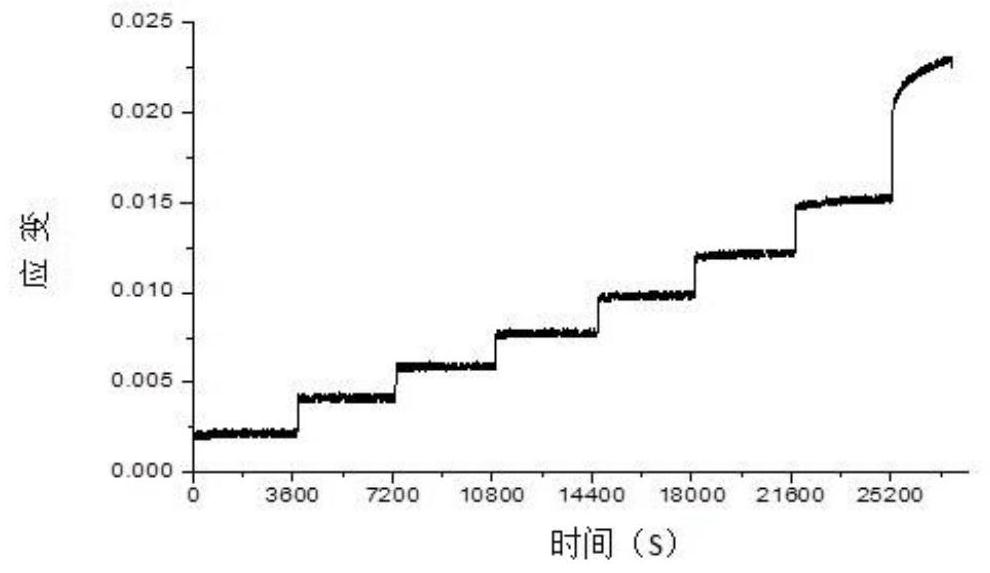
[0064] (1) Pass the 4mm×4mm×25mm semi-solid cast A365 (SSM-A365-T6) aluminum alloy sample after T6 heat treatment through the fixture, and fix it in the sample chamber of the creep deformation variable testing equipment, and place the temperature sensor in turn Align the upper, middle and lower positions of the sample;
[0065] (2) The height of the creep deformation variable testing equipment is adjusted to 500mm, and a creep variable measurement test rod with a length of 200mm is selected;
[0066] (3) Heat the sample to 25°C;
[0067] (4) Load 5% of the yield stress (360MPa) on the sample, that is, 18MPa, and then increase 18MPa every 1h until the sample breaks;
[0068] During the stress loading process, the load cell is used to transmit the stress values corresponding to different time intervals to the computer; the linear variable differential transformer is used to transmit the strain values under different stresses and at the same time interval to the c...
Embodiment 2
[0072]
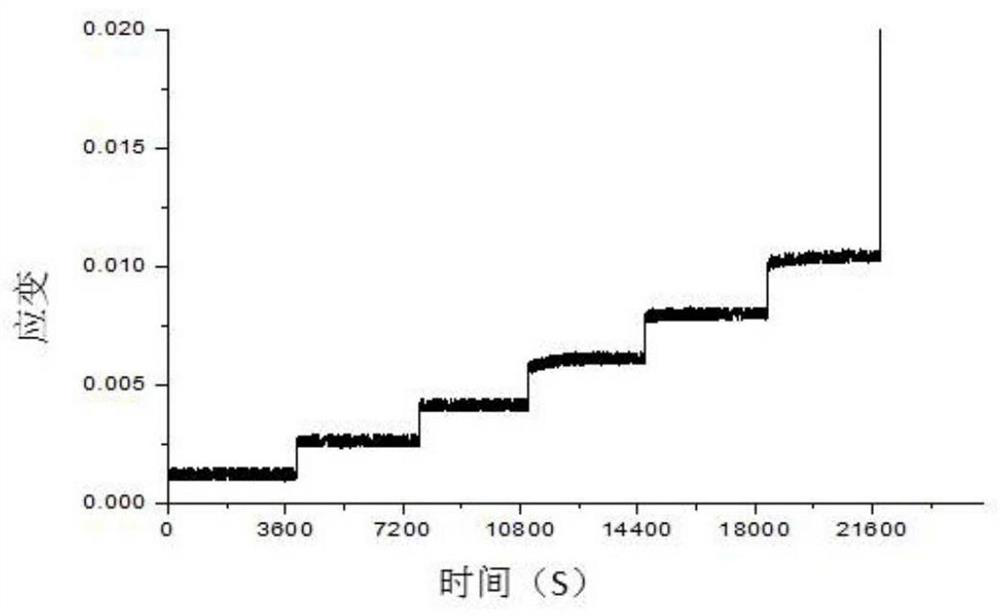
[0073] (1) except that the sample to be tested is the A365 (A365-T6) aluminum alloy after T6 heat treatment, all the other are identical with embodiment 1;
[0074] (2)-(3) are identical with embodiment 1;
[0075] (4) except that the yield stress (350MPa) of 5% is loaded to the sample, i.e. 17.5MPa, then, every 1h increases except that 17.5MPa, all the other are identical with embodiment 1;
[0076] (5) Same as Example 1.
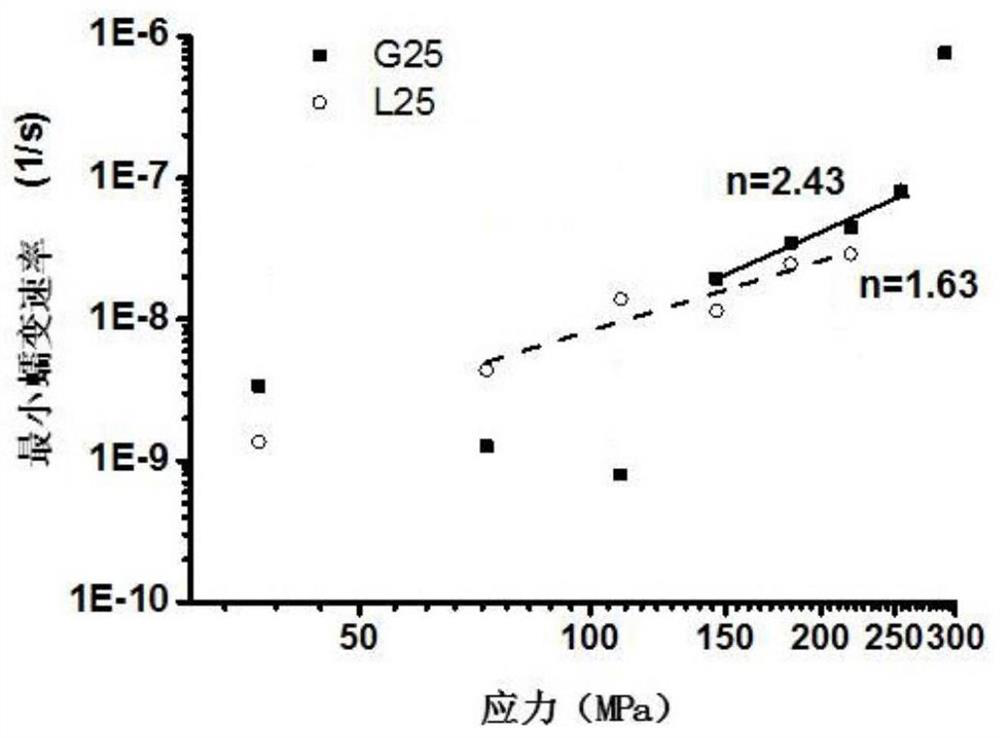
[0077] Among them, the obtained creep curve is as figure 2 Shown; minimum creep rate-creep stress logarithmic graph as image 3 shown.
Embodiment 3
[0079]
[0080] (1)-(2) are identical with embodiment 1;
[0081] (3) Heat the sample to 220°C;
[0082] (4) except that the yield stress (290MPa) of 5% is loaded on the sample, i.e. 14.5MPa, then, every 1h increases except that 14.5MPa, all the other are identical with embodiment 1;
[0083] (5) Same as Example 1.
[0084] Among them, the obtained creep curve is as Figure 4 Shown; minimum creep rate-creep stress logarithmic graph as Figure 10 shown.
PUM
| Property | Measurement | Unit |
|---|---|---|
| Length | aaaaa | aaaaa |
Abstract
Description
Claims
Application Information
 - R&D
- Intellectual Property
- Life Sciences
- Materials
- Tech Scout
- Unparalleled Data Quality
- Higher Quality Content
- 60% Fewer Hallucinations
Browse by: Latest US Patents, China's latest patents, Technical Efficacy Thesaurus, Application Domain, Technology Topic, Popular Technical Reports.
© 2025 PatSnap. All rights reserved.Legal|Privacy policy|Modern Slavery Act Transparency Statement|Sitemap|About US| Contact US: help@patsnap.com


