
Data optimization method based on normal distribution

A normal distribution and data technology, applied in the field of data processing, can solve problems such as misunderstanding of the global situation, failure to consider the distribution of global data, and wrong judgments, so as to improve accuracy, make data selection results reasonable, and avoid unfair problems Effect

Inactive Publication Date: 2021-05-11
INSPUR SOFTWARE CO LTD
View PDF3 Cites 4 Cited by
  • Summary
  • Abstract
  • Description
  • Claims
  • Application Information

AI Technical Summary

Problems solved by technology

But there is an obvious disadvantage in doing so. Assuming that the number of markets is 10, the sales status scores are: 99, 95, 93, 92, 85, 83, 81, 78, 76, 71; among them, the top three: 99, 95 and 93 are rated as excellent, but the difference between the fourth place 92 and the third place 93 is only one point. Obviously, this method does not take into account the distribution of global data
At the same time, the data selected by this method cannot reflect the actual situation of the global data, and it is easy for technicians to misunderstand the global situation and make wrong judgments

Method used


Image

  • Data optimization method based on normal distribution
  • Data optimization method based on normal distribution
  • Data optimization method based on normal distribution

Examples


Embodiment 1

[0052] Take the automated sorting of watermelons as an example. Automatically sort a batch of watermelons and divide them into first-class, second-class, and third-class products... and send them to the market for sale according to different prices.

[0053]First, use data acquisition devices such as cameras and microphones to collect data. Data is collected from outside the system and input to an interface inside the system. Specifically in this embodiment, a camera is installed on the assembly line to collect the color, pattern, shape of the pedicle, and size of the navel of each melon, and convert them into digital signals and store them in the database for subsequent classification.

[0054] Then, data cleaning is performed to remove outliers. Invalid and missing value checks are due to investigation, coding, and entry errors. There may be some invalid and missing values ​​in the data, which need to be dealt with appropriately. Specifically in this embodiment, variables...

Embodiment 2

[0061] If you want to divide this batch of melons into four grades, you can use the same method to calculate that the score of the first grade (25%) is greater than x1, the score of the second grade (25%) is greater than x2 and less than x1, and, the score of the third grade (accounting for 25%) with a score greater than x3 and less than x2, and the rest are grade 4 melons with a score less than x3 (accounting for 25%).

Embodiment 3

[0063] If you want to divide this batch of melons into two grades, eliminate the poorer inferior melons, and set the proportion of the inferior melons to be eliminated to 20%, set the normal distribution curve, x-axis and x∈(-∞, x 0 ) is set to 0.2, that is, A is 0.2, and the inverse function of the cumulative density function of the normal distribution can be used to obtain x 0 , with a score less than x 0 The watermelon is the inferior melon.


PUM


Abstract

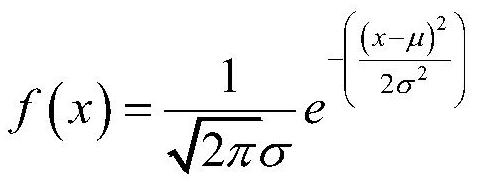
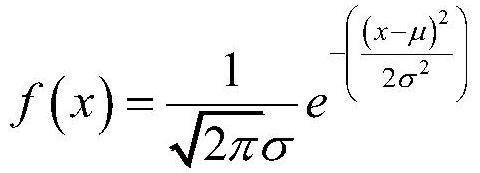
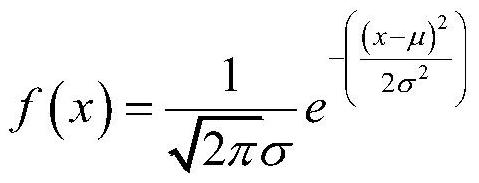
The invention particularly relates to a data optimization method based on normal distribution. According to the data optimization method based on normal distribution, data information is collected, and the collected data information is converted into numerical values to be stored in a database for standby application; checking the consistency of the data, and processing invalid values and missing values; using the cleaned data as a variable x, obtaining a normal distribution curve f (x) of the variable x according to a probability density function of normal distribution, setting an area enclosed by the normal distribution curve and an x axis as 1, and obtaining an optimal numerical value x0 through an inverse function of a normal distribution accumulation density function according to the proportion A of the preferred data in all the data. According to the data optimization method based on normal distribution, the dispersion degree and the distribution condition of the data are comprehensively considered, so that the problem of unfairness easily occurring in a conventional optimization strategy is avoided, a data optimization result is more reasonable, the actual condition of global data can be better reflected, and the accuracy of data optimization is improved.

Description

technical field [0001] The invention relates to the technical field of data processing, in particular to a data selection method based on normal distribution. Background technique [0002] Data selection refers to the selection of relatively excellent individuals from the group. The usual method is to first rank the individuals according to the observed attributes, and then select the top-ranked individuals. [0003] For example, when researching products, it is often necessary to judge in which markets a certain product sells well and which markets sell poorly, and formulate relevant incentive systems according to the different sales conditions. Generally speaking, technicians will sort each market according to the sales status of goods, from good to bad, and the top few are the best. But there is an obvious disadvantage in doing so. Assuming that the number of markets is 10, the sales status scores are: 99, 95, 93, 92, 85, 83, 81, 78, 76, 71; among them, the top three: 99...

Claims


Application Information

Patent Timeline
Patent Type & Authority Applications(China)
IPC IPC(8): G06F16/215G06N7/00
CPCG06F16/215G06N7/01
Inventor 姜振荣王国良黄少军邱实张鹏
Owner INSPUR SOFTWARE CO LTD
Learn More