Real-time dynamic three-dimensional visual display method for power transmission line

A power transmission line, real-time dynamic technology, applied in the direction of electromagnetic wave re-radiation, re-radiation utilization, data processing applications, etc., can solve problems such as difficult to process data smoothly, not intuitive enough, and unable to meet the working requirements of transmission line inspection data visualization , to achieve the effect of real-time dynamic display

Pending Publication Date: 2021-06-25
GUANGDONG POWER GRID CO LTD
View PDF0 Cites 1 Cited by
  • Summary
  • Abstract
  • Description
  • Claims
  • Application Information

AI Technical Summary

Problems solved by technology

[0003] The current transmission line management work is based on the traditional two-dimensional GIS technology. This technology has the disadvantage of not being intuitive enough, and it has gradually failed to meet the work requirements of transmission line inspection data visualization. Moreover, due to the continuous increase of transmission line data, the traditional GIS Two-dimensional GIS technology is difficult to smoothly process massive data

Method used


Image

  • Real-time dynamic three-dimensional visual display method for power transmission line
  • Real-time dynamic three-dimensional visual display method for power transmission line
  • Real-time dynamic three-dimensional visual display method for power transmission line

Examples


Embodiment approach

[0059] As an optional implementation manner, the following steps are also included:

[0060] The dynamic 3D scene generated by the 3D display model is sent to different terminals through the 5G cloud server. The terminals include mobile platforms (such as mobile phones, tablets and other mobile devices), workbenches (such as several workbenches set up at intervals along the transmission line), monitoring consoles, etc. The advantage of this processing is that it is convenient for the management personnel to know the situation of the transmission line randomly and anywhere, and it is convenient for the management personnel to manage the transmission line.

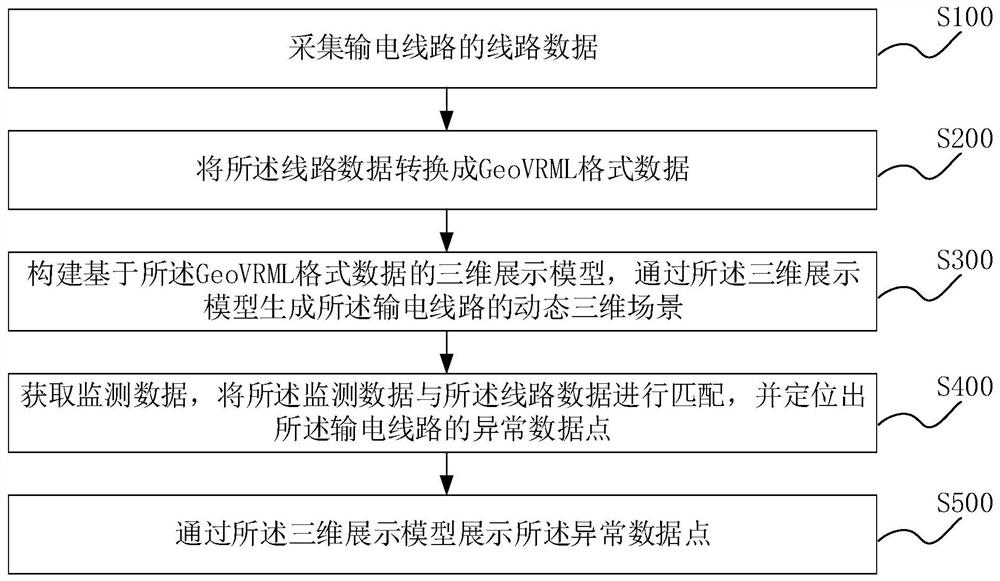
[0061] The present invention converts line data collected in real time into GeoVRML format data, and finally constructs a three-dimensional display model based on the GeoVRML format data, and generates a dynamic three-dimensional scene of the transmission line through the three-dimensional display model. Compared with tradi...


PUM


Abstract

The invention discloses a real-time dynamic three-dimensional visual display method for a power transmission line, and relates to the technical field of power equipment management, and the method comprises the following steps: collecting line data of the power transmission line; converting the line data into data in a GeoVRML format; and constructing a three-dimensional display model based on the GeoVRML format data, and generating a dynamic three-dimensional scene of the power transmission line through the three-dimensional display model. Compared with a traditional two-dimensional GIS technology, three-dimensional visual management of the power transmission line can be achieved, a three-dimensional display model based on GeoVRML format data is used, conversion from large-scale line data to a GeoVRML data file format is achieved, large-scale line data is simplified and expressed in a multi-resolution mode through the GeoVRML, and rapid, accurate and real-time dynamic display of mass data is realized.

Description

technical field [0001] The invention relates to the technical field of power equipment management, in particular to a real-time dynamic three-dimensional visualization display method for power transmission lines. Background technique [0002] The geographical environment that transmission lines pass through is relatively complicated, and many of them are inaccessible mountainous areas, which brings many difficulties and risks to the inspection of transmission lines. Once there is a problem with the transmission line, it will have a major impact on the national production. With the increase of transmission line data acquisition channels, the amount of information on the transmission line is increasing day by day, thus putting forward new requirements for the operation and maintenance management of the transmission line. [0003] The current transmission line management work is based on the traditional two-dimensional GIS technology. This technology has the disadvantage of not...

Claims


Application Information

Patent Timeline
Patent Type & Authority Applications(China)
IPC IPC(8): G06T17/00G06Q10/00G06Q50/06G01S17/88G01S19/14
CPCG01S17/88G01S19/14G06Q10/20G06Q50/06G06T17/00
Inventor 郭锦超刘高廖建东周强辅蒙华伟彭炽刚朱凌范亚洲郭圣周华敏李国强
Owner GUANGDONG POWER GRID CO LTD
Why Eureka
Try Eureka