Graphical generation method and device of industrial index component and electronic equipment

A graphical and component technology, applied in the field of data visualization, can solve the problems of high technical requirement threshold, complex generation process, low reusability, etc., and achieve the effect of alleviating high technical requirement threshold, simple and convenient process, and high reusability

Inactive Publication Date: 2021-11-26
ROOTCLOUD TECH CO LTD
View PDF6 Cites 2 Cited by
  • Summary
  • Abstract
  • Description
  • Claims
  • Application Information

AI Technical Summary

Problems solved by technology

[0005] In view of this, the purpose of the present invention is to provide a graphical generation method, device and electronic equipment of industrial index components, so as to alleviate the technical requirements of the existing industrial index component generation methods for personnel, high technical requirements, complex generation process, and complicated process. Low usability technical issues

Method used


Image

  • Graphical generation method and device of industrial index component and electronic equipment
  • Graphical generation method and device of industrial index component and electronic equipment
  • Graphical generation method and device of industrial index component and electronic equipment

Examples


Embodiment 1

[0049] According to an embodiment of the present invention, an embodiment of a method for graphically generating industrial index components is provided. It should be noted that the steps shown in the flow chart of the accompanying drawings can be implemented in a computer system such as a set of computer-executable instructions and, although a logical order is shown in the flowcharts, in some cases the steps shown or described may be performed in an order different from that shown or described herein.

[0050] figure 1 It is a flowchart of a graphical generation method of an industrial indicator component according to an embodiment of the present invention, such as figure 1 As shown, the method includes the following steps:

[0051] Step S102, displaying the single-graph creation page according to the user-triggered operation of adding a chart, wherein the single-graph creation page includes data sources and basic chart components;

[0052] In the embodiment of the present ...

Embodiment 2

[0096] The embodiment of the present invention also provides an industrial component generation device, the industrial component generation device is mainly used to implement the industrial component generation method provided in the first embodiment of the present invention, the following is the industrial component provided by the embodiment of the present invention The generation device is introduced in detail.

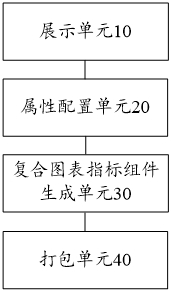
[0097] Figure 8 is a schematic diagram of a graphical generation device of an industrial indicator component according to an embodiment of the present invention, such as Figure 8 As shown, the device mainly includes: a display unit 10, an attribute configuration unit 20, a composite chart indicator component generation unit 30 and a packaging unit 40, wherein:

[0098] The display unit is used to display the single-graph creation page according to the operation of adding a chart triggered by the user, wherein the single-graph creation page includes data sources ...


PUM


Abstract

The invention provides a graphical generation method and device of an industrial index component and electronic equipment, and the method comprises the steps: displaying a single graph making page according to a graph adding operation triggered by a user, wherein the single graph making page comprises a data source and a basic graph component; performing attribute configuration on the target basic chart component selected by the user through the target data source selected by the user to obtain a single chart index component; continuing to execute the chart adding operation in the page of the single chart index component to generate a plurality of chart index components in the page of the chart editor so as to obtain a composite chart index component; and packaging the composite chart index component to generate an industrial index component. According to the method, manufacturing of the industrial index component can be completed through the visual chart editor, the technical threshold for developing the industrial index component is greatly reduced, the process is simple and convenient, and reusability is high.

Description

technical field [0001] The invention relates to the technical field of data visualization, in particular to a graphical generation method, device and electronic equipment of industrial index components. Background technique [0002] In order to ensure the normal and stable operation of industrial production and equipment, the detection and monitoring of key indicators is very important for enterprise operators. As the production process of the process industry becomes more and more complex, the index system of the enterprise is complicated, which is also a challenge to the processing and presentation of data. Metric data for industrial systems is often represented by components. [0003] The development process of the industrial indicator component (statistical chart component for displaying industrial system indicator data) is: use the offline compiler to complete the development of the basic statistical chart component, and then bind an indicator data model to the statist...

Claims


Application Information

Patent Timeline
Patent Type & Authority Applications(China)
IPC IPC(8): G06F8/34G06F8/33G06F8/38
CPCG06F8/34G06F8/33G06F8/38
Inventor 马敏刘剑彭杉
Owner ROOTCLOUD TECH CO LTD
Why Eureka
Try Eureka