Power grid load data display method and device, electronic equipment and storage medium
A technology of power grid load and load data, applied in the field of data processing, can solve the problems of inconvenient search, inactive display effect, and inability to quickly find related data, etc., to achieve the effect of simple operation process and vivid display method.
- Summary
- Abstract
- Description
- Claims
- Application Information
AI Technical Summary
Problems solved by technology
Method used
Image

Examples
Embodiment 1
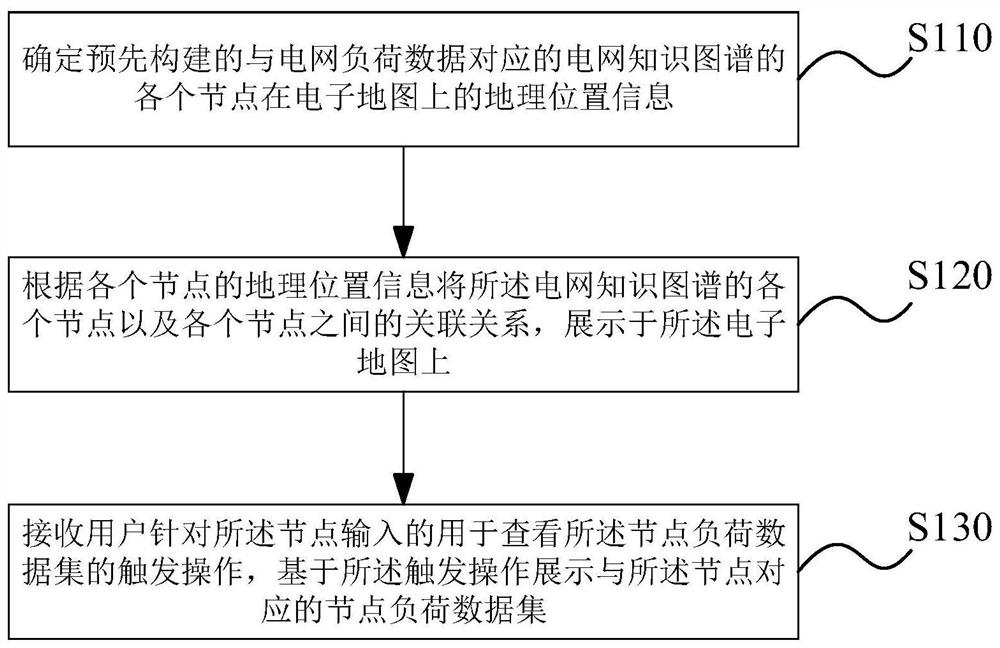
[0027] figure 1 It is a schematic flowchart of a display method for grid load data provided by Embodiment 1 of the present invention. This embodiment is applicable to the situation of viewing grid load data on an electronic map, and the method can be executed by a display device for grid load data , the device can be realized by software and / or hardware, and can be configured in a terminal and / or server to realize the display method of grid load data in the embodiment of the present invention.
[0028] Such as figure 1 As shown, the method in this embodiment may specifically include:
[0029] S110. Determine the geographic position information of each node on the electronic map of the pre-built grid knowledge map corresponding to the grid load data.
[0030] Among them, the grid load data can include different types of load data. According to the relationship between power generation and supply in the power system, the grid load data can include power generation load data, p...
Embodiment 2
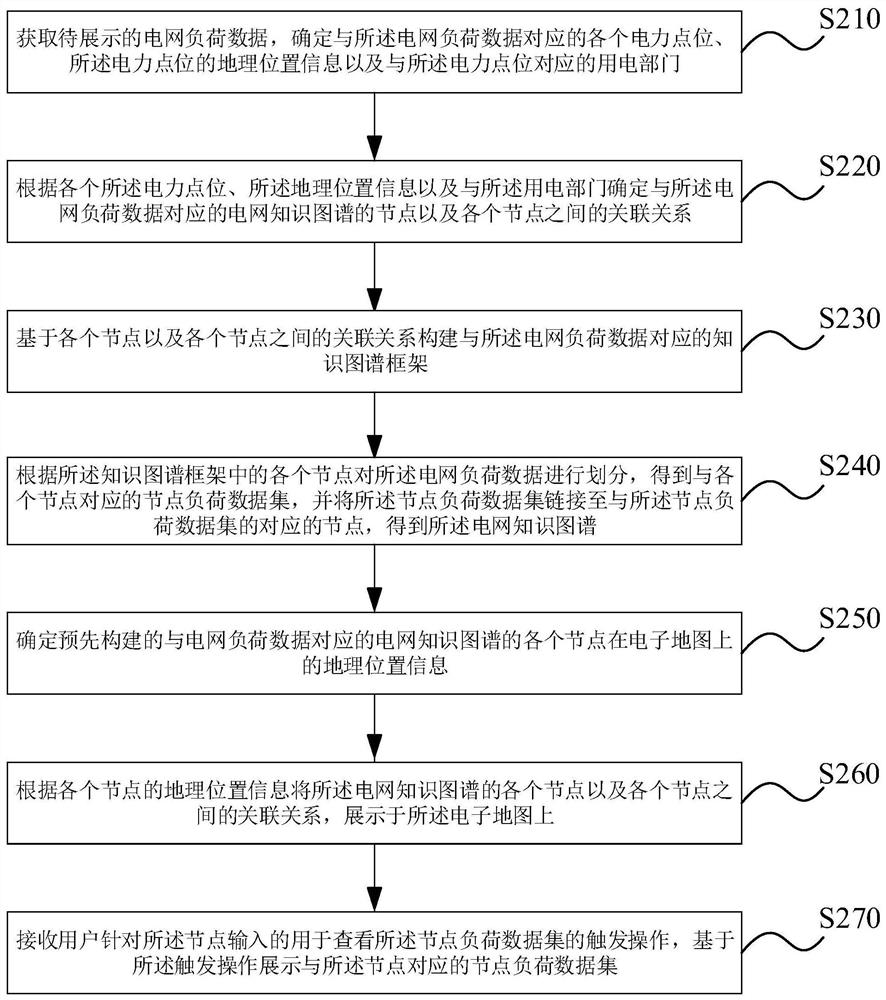
[0042] figure 2 It is a schematic flowchart of a method for constructing a power grid knowledge map in a method for displaying power grid load data provided by Embodiment 2 of the present invention. On the basis of the above technical solution, optionally, the power grid Before each node of the knowledge graph and the association relationship between each node are displayed on the electronic map, the power grid knowledge graph is constructed. For its specific implementation, refer to the detailed description of the technical solution.
[0043] see figure 2 As shown, the method in the embodiment of the present invention may include the following steps:
[0044] S210. Acquire the grid load data to be displayed, and determine each power point corresponding to the power grid load data, the geographical location information of the power point, and the power consumption department corresponding to the power point.
[0045] In this embodiment, the collected grid load data can be...
Embodiment 3
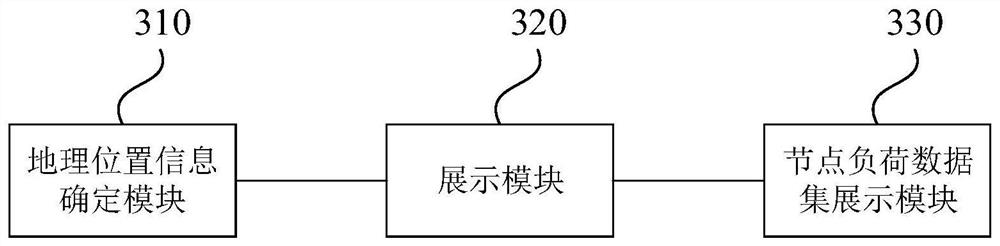
[0077] image 3 It is a schematic structural diagram of a grid load data display device provided in Embodiment 3 of the present invention. The grid load data display device provided in this embodiment can be implemented by software and / or hardware, and can be configured in a terminal and / or server In order to realize the display method of the grid load data in the embodiment of the present invention. The device may specifically include: a geographical position information determining module 310 , a display module 320 and a node load data set display module 330 .
[0078] Wherein, the geographic location information determination module 310 is used to determine the geographic location information of each node on the electronic map of the pre-built grid knowledge map corresponding to the grid load data;
[0079] The display module 320 is configured to display each node of the power grid knowledge graph and the association relationship between each node on the electronic map acc...
PUM
 Abstract
Description
Claims
Application Information