
Mathematical model-based Lake-entering river pollution influence degree evaluation method

A technology that affects the degree of impact and river pollution. It is applied in data processing applications, general water supply conservation, instruments, etc. It can solve problems such as unmonitored peak concentrations of pollutants, and achieve ecological and environmental protection. Significant economic and social benefits, The effect of easy-to-operate applications

Pending Publication Date: 2022-01-11
HOHAI UNIV
View PDF0 Cites 2 Cited by
  • Summary
  • Abstract
  • Description
  • Claims
  • Application Information

AI Technical Summary

Problems solved by technology

[0003] However, field monitoring has limitations in time, and the peak concentration of pollutants brought about by rainfall may not be detected, which leads to certain limitations in the evaluation of river pollution.

Method used


Image

  • Mathematical model-based Lake-entering river pollution influence degree evaluation method
  • Mathematical model-based Lake-entering river pollution influence degree evaluation method
  • Mathematical model-based Lake-entering river pollution influence degree evaluation method

Examples


Embodiment 1

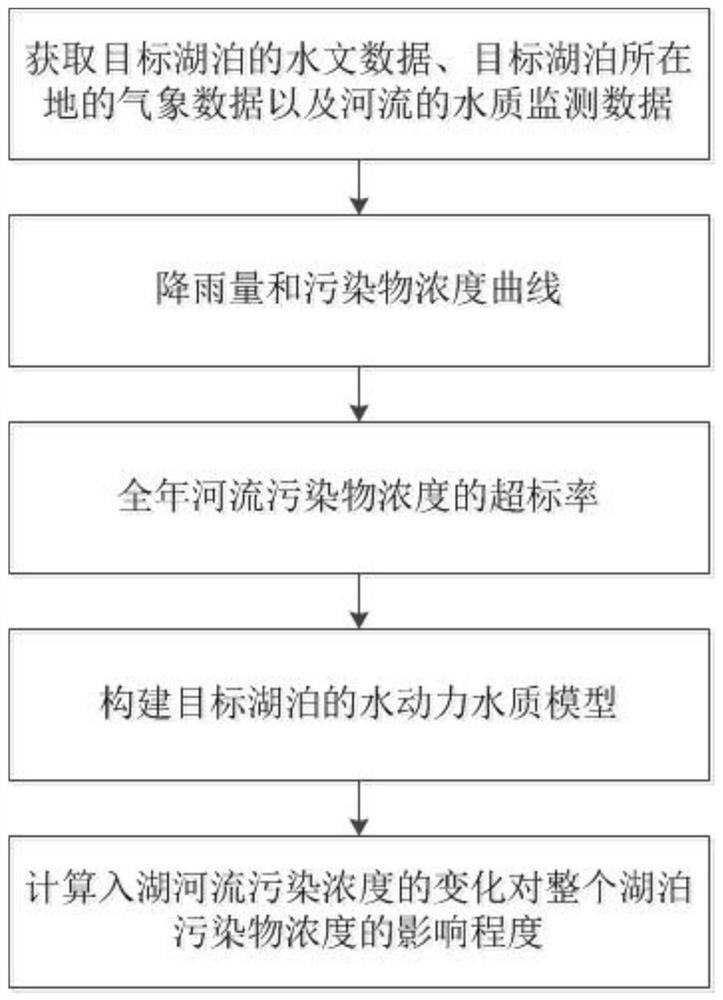
[0054] Such as figure 1 As shown, a mathematical model-based method for assessing the degree of pollution impact of rivers entering the lake, the specific steps include:

[0055] Step 1: Obtain the hydrological data of the target lake, the meteorological data of the location of the target lake, and the water quality monitoring data of the river.

[0056] Step 2: Based on the water quality monitoring data, extract the river pollutant concentration monitored in rainy days, and use the regression analysis method to obtain the rainfall and pollutant concentration curves.

[0057] Pollutants include at least: permanganate index, COD, ammonia nitrogen, total nitrogen, and total phosphorus.

[0058] Obtaining rainfall and pollutant concentration curves include:

[0059] Determining the rainfall level according to the amount of rainfall,

[0060] Filter the function used in the regression analysis for each rainfall class;

[0061] Analyze the results with regression in R 2 Based ...

Embodiment 2

[0093] Using the method provided in Example 1, calculate the river X entering the lake 1 The extent to which pollution affects Lake A.

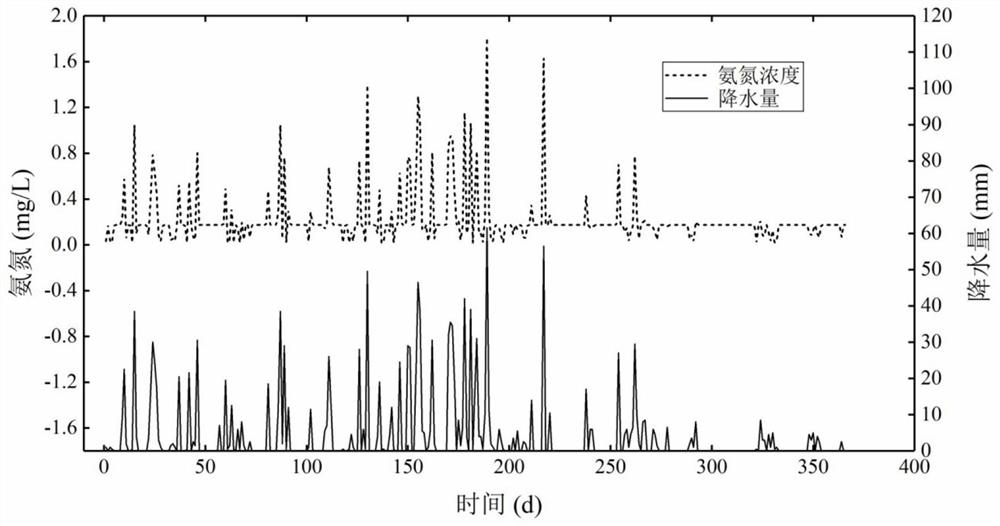
[0094] According to steps 1-3, get as figure 2 Year-round River X shown 1 Pollutant concentration distribution map.

[0095] According to step 4, the hydrodynamic water quality model of lake A is established. Using the established hydrodynamic water quality model, the concentration of river pollutants monitored in rainy days is calculated to obtain the model mean value. Compare the measured mean value of rainy day monitoring with the model mean value, as shown in Table 1:

[0096] Table 1: Lake A model validation results

[0097]

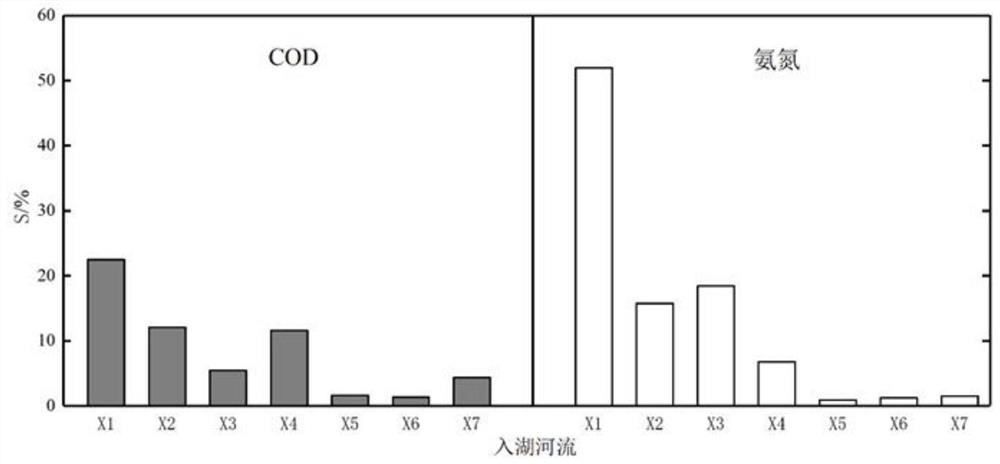
[0098] According to step 5, under the condition that the boundary disturbance is 30% increase or decrease in the pollution load of the river entering the lake, the degree of influence is calculated, as follows: image 3 Shown are the results of the degree of pollution impact on rivers entering the lake. ...


PUM


Abstract

The invention discloses a mathematical model-based lake-entering river pollution influence degree evaluation method, which comprises the following steps: extracting river pollutant concentration monitored in rainy days based on water quality monitoring data, and obtaining a rainfall and pollutant concentration curve by adopting a regression analysis method; according to the rainfall and pollutant concentration curve, obtaining water quality monitoring data which are not monitored in rainy days, and calculating the over-standard rate of the river pollutant concentration all the year round; based on the hydrological data and the meteorological data of the target lake, constructing a hydrodynamic water quality model of the target lake; and based on the hydrodynamic water quality model of the target lake, calculating the influence degree of the change of the pollution concentration of the lake-entering river on the pollutant concentration of the whole lake. The invention can make up for the shortage of monitoring time, and comprehensively judges the pollution influence degree of the lake-entering rivers at different hydrological periods and geographic positions.

Description

technical field [0001] The invention relates to a mathematical model-based method for evaluating the pollution impact degree of rivers entering a lake, and belongs to the technical field of regional water environment management. Background technique [0002] The river, a special water body, connects the material and the environment between water bodies, and is a very important transmission path. Among them, the rivers that enter the lake have more important functions. Serious pollution in the river can significantly deteriorate the overall ecological environment of the lake. Rainfall has two effects: erosion and dilution. Erosion will cause pollutants to leave their original position and flow into the water body with runoff. Dilution will reduce the concentration of pollutants in the water body. The two forces are different in magnitude and will cause pollution in the water body. increase or decrease in concentration. [0003] However, field monitoring has limitations in ti...

Claims


Application Information

Patent Timeline
Patent Type & Authority Applications(China)
IPC IPC(8): G06Q10/06G06Q50/26
CPCG06Q10/06393G06Q50/26Y02A20/152
Inventor 李一平王亚宁程月王煜潘泓哲周玉璇李金华
Owner HOHAI UNIV
Learn More