Visualization method and device for water productivity of land parcels

A productivity and plot technology, applied in the field of remote sensing, can solve problems such as incomplete reflection, time-consuming and labor-intensive efficiency, and inability to see changes in plots, reducing calculation time and improving efficiency.

Pending Publication Date: 2022-05-27
杭州领见数字农业科技有限公司
View PDF0 Cites 0 Cited by
  • Summary
  • Abstract
  • Description
  • Claims
  • Application Information

AI Technical Summary

Problems solved by technology

[0005] The present invention provides a visualization method and device for plot water productivity, aiming to solve the problems of incomplete reflection, inability to intuitively analyze the advantages and disadvantages in space, time-consuming and labor-intensive low efficiency, long calculation period, and inability to see plots Variations within and the inability to show water productivity potential for non-vegetated locations

Method used


Image

  • Visualization method and device for water productivity of land parcels
  • Visualization method and device for water productivity of land parcels
  • Visualization method and device for water productivity of land parcels

Examples


Embodiment 1

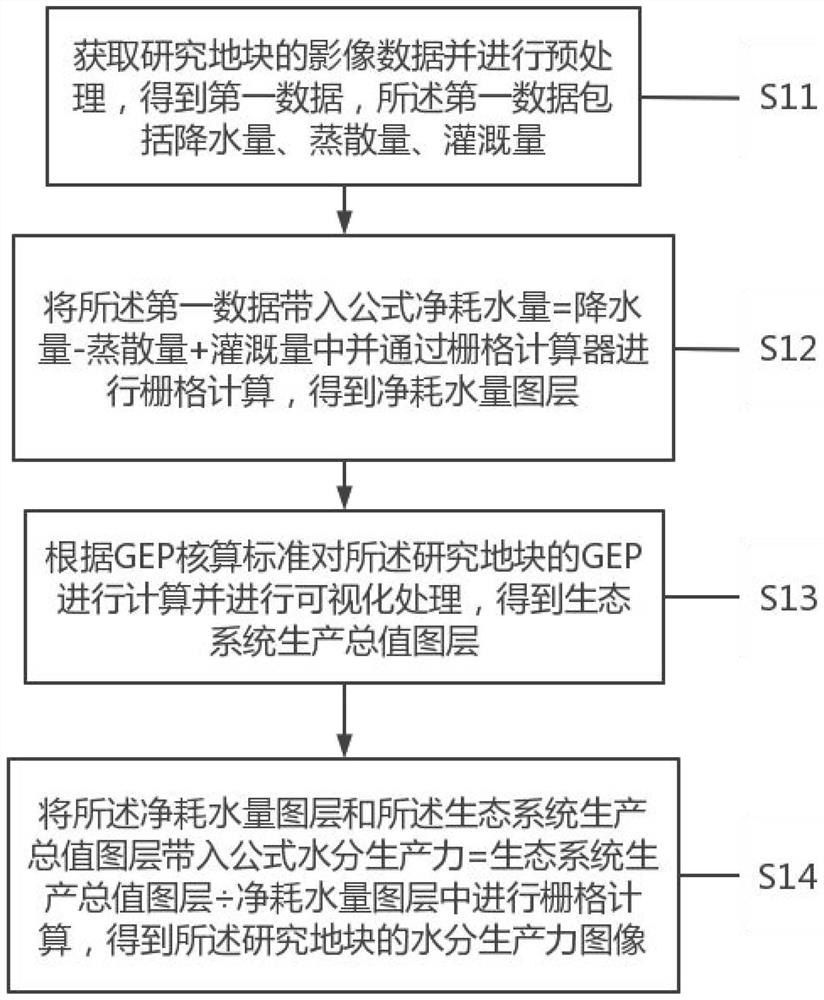
[0052] like figure 1 shown, a visualization method of plot moisture productivity, including:

[0053] S11. Acquire image data of the research plot and perform preprocessing to obtain first data, where the first data includes precipitation, evapotranspiration, and irrigation;

[0054] S12, bringing the first data into the formula net water consumption=precipitation-evapotranspiration+irrigation and performing grid calculation with a grid calculator to obtain a net water consumption layer;

[0055] S13. Calculate and visualize the GEP of the research plot according to the GEP accounting standard to obtain a layer of ecosystem gross product;

[0056] S14. Bring the net water consumption layer and the ecosystem gross product layer into the formula water productivity=ecosystem gross product layer÷net water consumption layer to perform grid calculation to obtain the research site Moisture productivity image of the block.

[0057] In this embodiment, a fixed range of plots is firs...

Embodiment 2

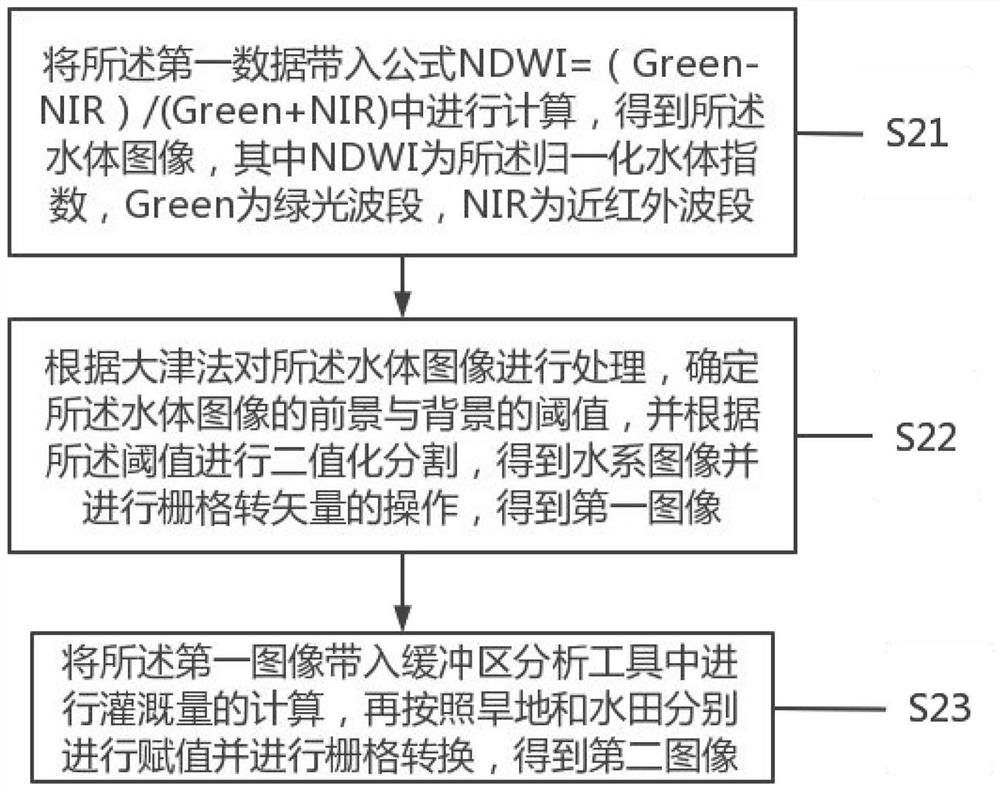
[0069] like figure 2 As shown in the figure, a method for calculating the annual value data of an irrigation volume layer includes the following steps:

[0070] S21. Bring the first data into the formula NDWI=(Green-NIR) / (Green+NIR) for calculation to obtain the water body image, where NDWI is the normalized water body index, and Green is the green light band , NIR is the near-infrared band;

[0071] S22. Process the water body image according to the Otsu method, determine the thresholds of the foreground and background of the water body image, and perform binarization segmentation according to the thresholds to obtain a water system image and perform a grid-to-vector operation to obtain the first an image;

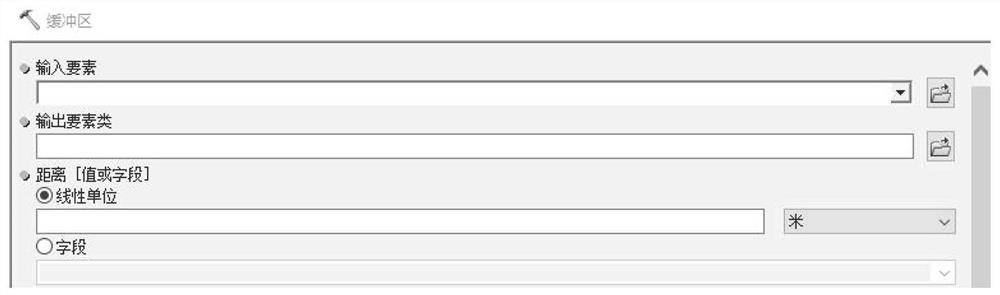
[0072]S23. Bring the first image into the buffer analysis tool to calculate the amount of irrigation, and then assign values ​​according to the dry land and paddy field and perform grid conversion to obtain a second image.

[0073] In this embodiment, the calculation ...

Embodiment 3

[0088] like Figure 4 shown, a visualization device for plot moisture productivity, including:

[0089] Data preprocessing module 100: used to acquire and preprocess image data of the research plot to obtain first data, where the first data includes precipitation, evapotranspiration, and irrigation;

[0090] Net water consumption calculation module 200: used to bring the first data into the formula net water consumption=precipitation-evapotranspiration+irrigation, and perform grid calculation through a grid calculator to obtain a net water consumption layer;

[0091] GEP calculation module 300: used to calculate and visualize the GEP of the research plot according to the GEP accounting standard, to obtain the ecosystem gross product layer;

[0092] Water productivity calculation module 400: used to bring the net water consumption layer and the ecosystem gross product layer into the formula water productivity=ecosystem gross product layer÷net water consumption layer to perform...


PUM


Abstract

The invention provides a plot moisture productivity visualization method and device, and relates to the technical field of remote sensing, and the method comprises the steps: obtaining image data of a research plot, and carrying out the preprocessing of the image data, and obtaining first data; substituting the first data into a formula net water consumption = precipitation-evapotranspiration + irrigation volume for grid calculation to obtain a net water consumption layer; calculating the GEP of the research plot according to a GEP accounting standard and performing visualization processing to obtain an ecological system total production value layer; and substituting the result into a formula water productivity = ecological system total production value map layer/net water consumption map layer for grid calculation to obtain a water productivity image of the research plot. According to the technical scheme, the moisture productivity is defined as the ratio of the total production value of the ecological system to the net water consumption, and the originally defined crop yield and economic value thereof are included, so that the moisture productivity calculated in the scheme can reflect the efficiency of all aspects of the whole ecological system, and the data content reflected by the calculated result is more comprehensive.

Description

technical field [0001] The invention belongs to the field of remote sensing technology, and in particular relates to a visualization method and device for water productivity of a plot. Background technique [0002] The shortage of water resources is an important factor restricting the sustainable development of my country's agriculture. As a large agricultural country, agricultural production accounts for 62.3% of my country's water resources consumption. With the emergence of economic, industrial development and various environmental problems, the water resources available for agriculture are gradually decreasing, and the continuous expansion of irrigated area is approaching the limit. Improving water productivity has become an important goal of agricultural production. The traditional definition of water productivity refers to the yield or output value obtained per unit of water resources under certain crop varieties and cultivation conditions, in kilograms per cubic meter...

Claims


Application Information

Patent Timeline
Patent Type & Authority Applications(China)
IPC IPC(8): G06V20/13G06V20/10G06V10/26G01N21/25G06T11/20G06T3/40
CPCG01N21/25G06T11/203G06T11/206G06T3/4007
Inventor 周祖煜陈煜人张澎彬於维维白博文莫志敏林波张浩李天齐刘俊
Owner 杭州领见数字农业科技有限公司
Why Eureka
Try Eureka