Eureka AIR delivers breakthrough ideas for toughest innovation challenges, trusted by R&D personnel around the world.

Map firework assembly implementation method based on Echarts

An implementation method, fireworks technology, applied in pyrotechnics, image data processing, instruments, etc., can solve the problem of not being intuitive enough for data changes, and achieve the effect of improving experience and displaying intuitively

Pending Publication Date: 2022-06-24
海看网络科技(山东)股份有限公司
View PDF0 Cites 0 Cited by
  • Summary
  • Abstract
  • Description
  • Claims
  • Application Information

AI Technical Summary

Problems solved by technology

[0004] In order to overcome the shortcomings, the purpose of the present invention is to provide a new general display component to solve the problem that the data changes are not intuitive enough when the Echarts map displays the regional data

Method used


Image

  • Map firework assembly implementation method based on Echarts
  • Map firework assembly implementation method based on Echarts

Examples


Embodiment Construction

[0017] The present invention will now be described in further detail with reference to the accompanying drawings.

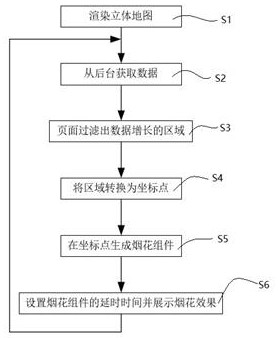
[0018] according to figure 1 , 2 An implementation method of the Echarts-based map firework component shown, specifically includes:

[0019] S1. Render a three-dimensional map, create a map component, which includes GeoJSon map data and a corresponding table of area names and location coordinates. The map component uses Echarts combined with GeoJSon map data to render multiple maps on the page and overlay the maps. The map component The z value of the z value decreases in turn, the position is shifted downward and left in turn, and the shadow color and shadow size are set to present a three-dimensional map effect;

[0020] S2, obtain data from the background regularly, and pass the obtained data and the method of judging the growth of the data into the component;

[0021] S3. The map component filters out the area names with data growth according to the data o...


PUM


Abstract

The invention belongs to the technical field of data representation, and particularly relates to an Echarts-based map firework assembly implementation method, which comprises the following steps of: rendering a three-dimensional map; regularly acquiring data from the background; filtering out a data increasing region; converting the region into coordinate points; creating a firework assembly for each coordinate point; and the delay time of animation display of each firework assembly is randomly set, so that the animations of the coordinate points are staggered. According to the method and the device, the problem that display is not visual when the Echarts map data is increased is solved, if the data is increased, the data is circularly displayed in a fireworks mode in a data query period, and the scheme enables the display to be more visual and greatly improves the user experience.

Description

technical field [0001] The invention relates to the technical field of data representation, in particular to a method for realizing a map firework component based on Echarts. Background technique [0002] Echarts is an open-source visualization library implemented in JavaScript, compatible with most current browsers, and relies on the vector graphics library ZRender at the bottom to provide intuitive, interactive, and highly customizable data visualization charts, including a map component, which can Use GeoJSon format map data to draw maps. In actual use, Echarts' map component is often used to display data such as population distribution density from the dimension of administrative divisions. Currently, in the map component, the data is displayed in the form of text. Within a geographic area, map data is mainly displayed in the form of color, text or histogram. When there are many areas or the values ​​are relatively large, users cannot find the changes and trends of the v...

Claims


Application Information

Patent Timeline
Patent Type & Authority Applications(China)
IPC IPC(8): G06T17/05G06T19/20F42B4/00
CPCG06T17/05G06T19/20F42B4/00
Inventor 高岩董莹王文龙张晓刚隆龙
Owner 海看网络科技(山东)股份有限公司
Why Eureka
Eureka Blog
Learn More